Solana Plunges 13%: Can Key On-Chain Support Stop The Fall?


Solana has declined by around 13% in the past week, which has brought the asset back to a major on-chain support cluster. Could this be where the bleed ends?
Solana Has Strong On-Chain Support Between $145 & $147
In a new post on X, the on-chain analytics firm Glassnode has talked about where support and resistance levels lie for Solana based on the Cost Basis Distribution (CBD) metric.
The Cost Basis Distribution tells us about how much of the cryptocurrency’s circulating supply was last purchased or transferred at what spot price. Below is the chart shared by Glassnode that shows the data of the indicator for Solana over the past few months.

As is visible, there are a few price zones near the current Solana spot price that stand out in terms of the amount of supply that they hold. The $155 to $157 range carries the cost basis of around 31 million tokens and the $164 to $166 range that of 29 million tokens.
A third demand zone exists at $145 to $147, a region that the cryptocurrency’s price is currently making a retest of. Here, the investors last purchased a total of 13 million SOL.
To any investor, their cost basis is an important level, so they are more likely to show some kind of move when a retest of it occurs. Generally, this type of reaction isn’t anything relevant for the asset when just a few holders share their acquisition mark at the level, but when a large amount of them are involved, like in the case of the range that SOL is retesting right now, a sizeable reaction can sometimes appear.
Generally, these moves tend toward buying when the retest occurs from above. That is, when the investors were in the green prior to the retest. This happens because these holders might believe the price decline to be just a dip opportunity or they may simply want to protect their cost basis.
Similarly, holders might panic sell when the retest happens from below. This could happen because underwater sellers can be desperate to get back into the green and once they do, they might fear that the rise is only temporary so they could push for the exit.
As Solana is retesting the $145 to $147 range from above, it’s possible that buyers from this region could provide support to the asset and help cushion its fall. In the event that a turnaround does happen, the $155 to $157 resistance range could be of focus next.
The analytics firm has also shared the CBD of another altcoin, Tron (TRX) .
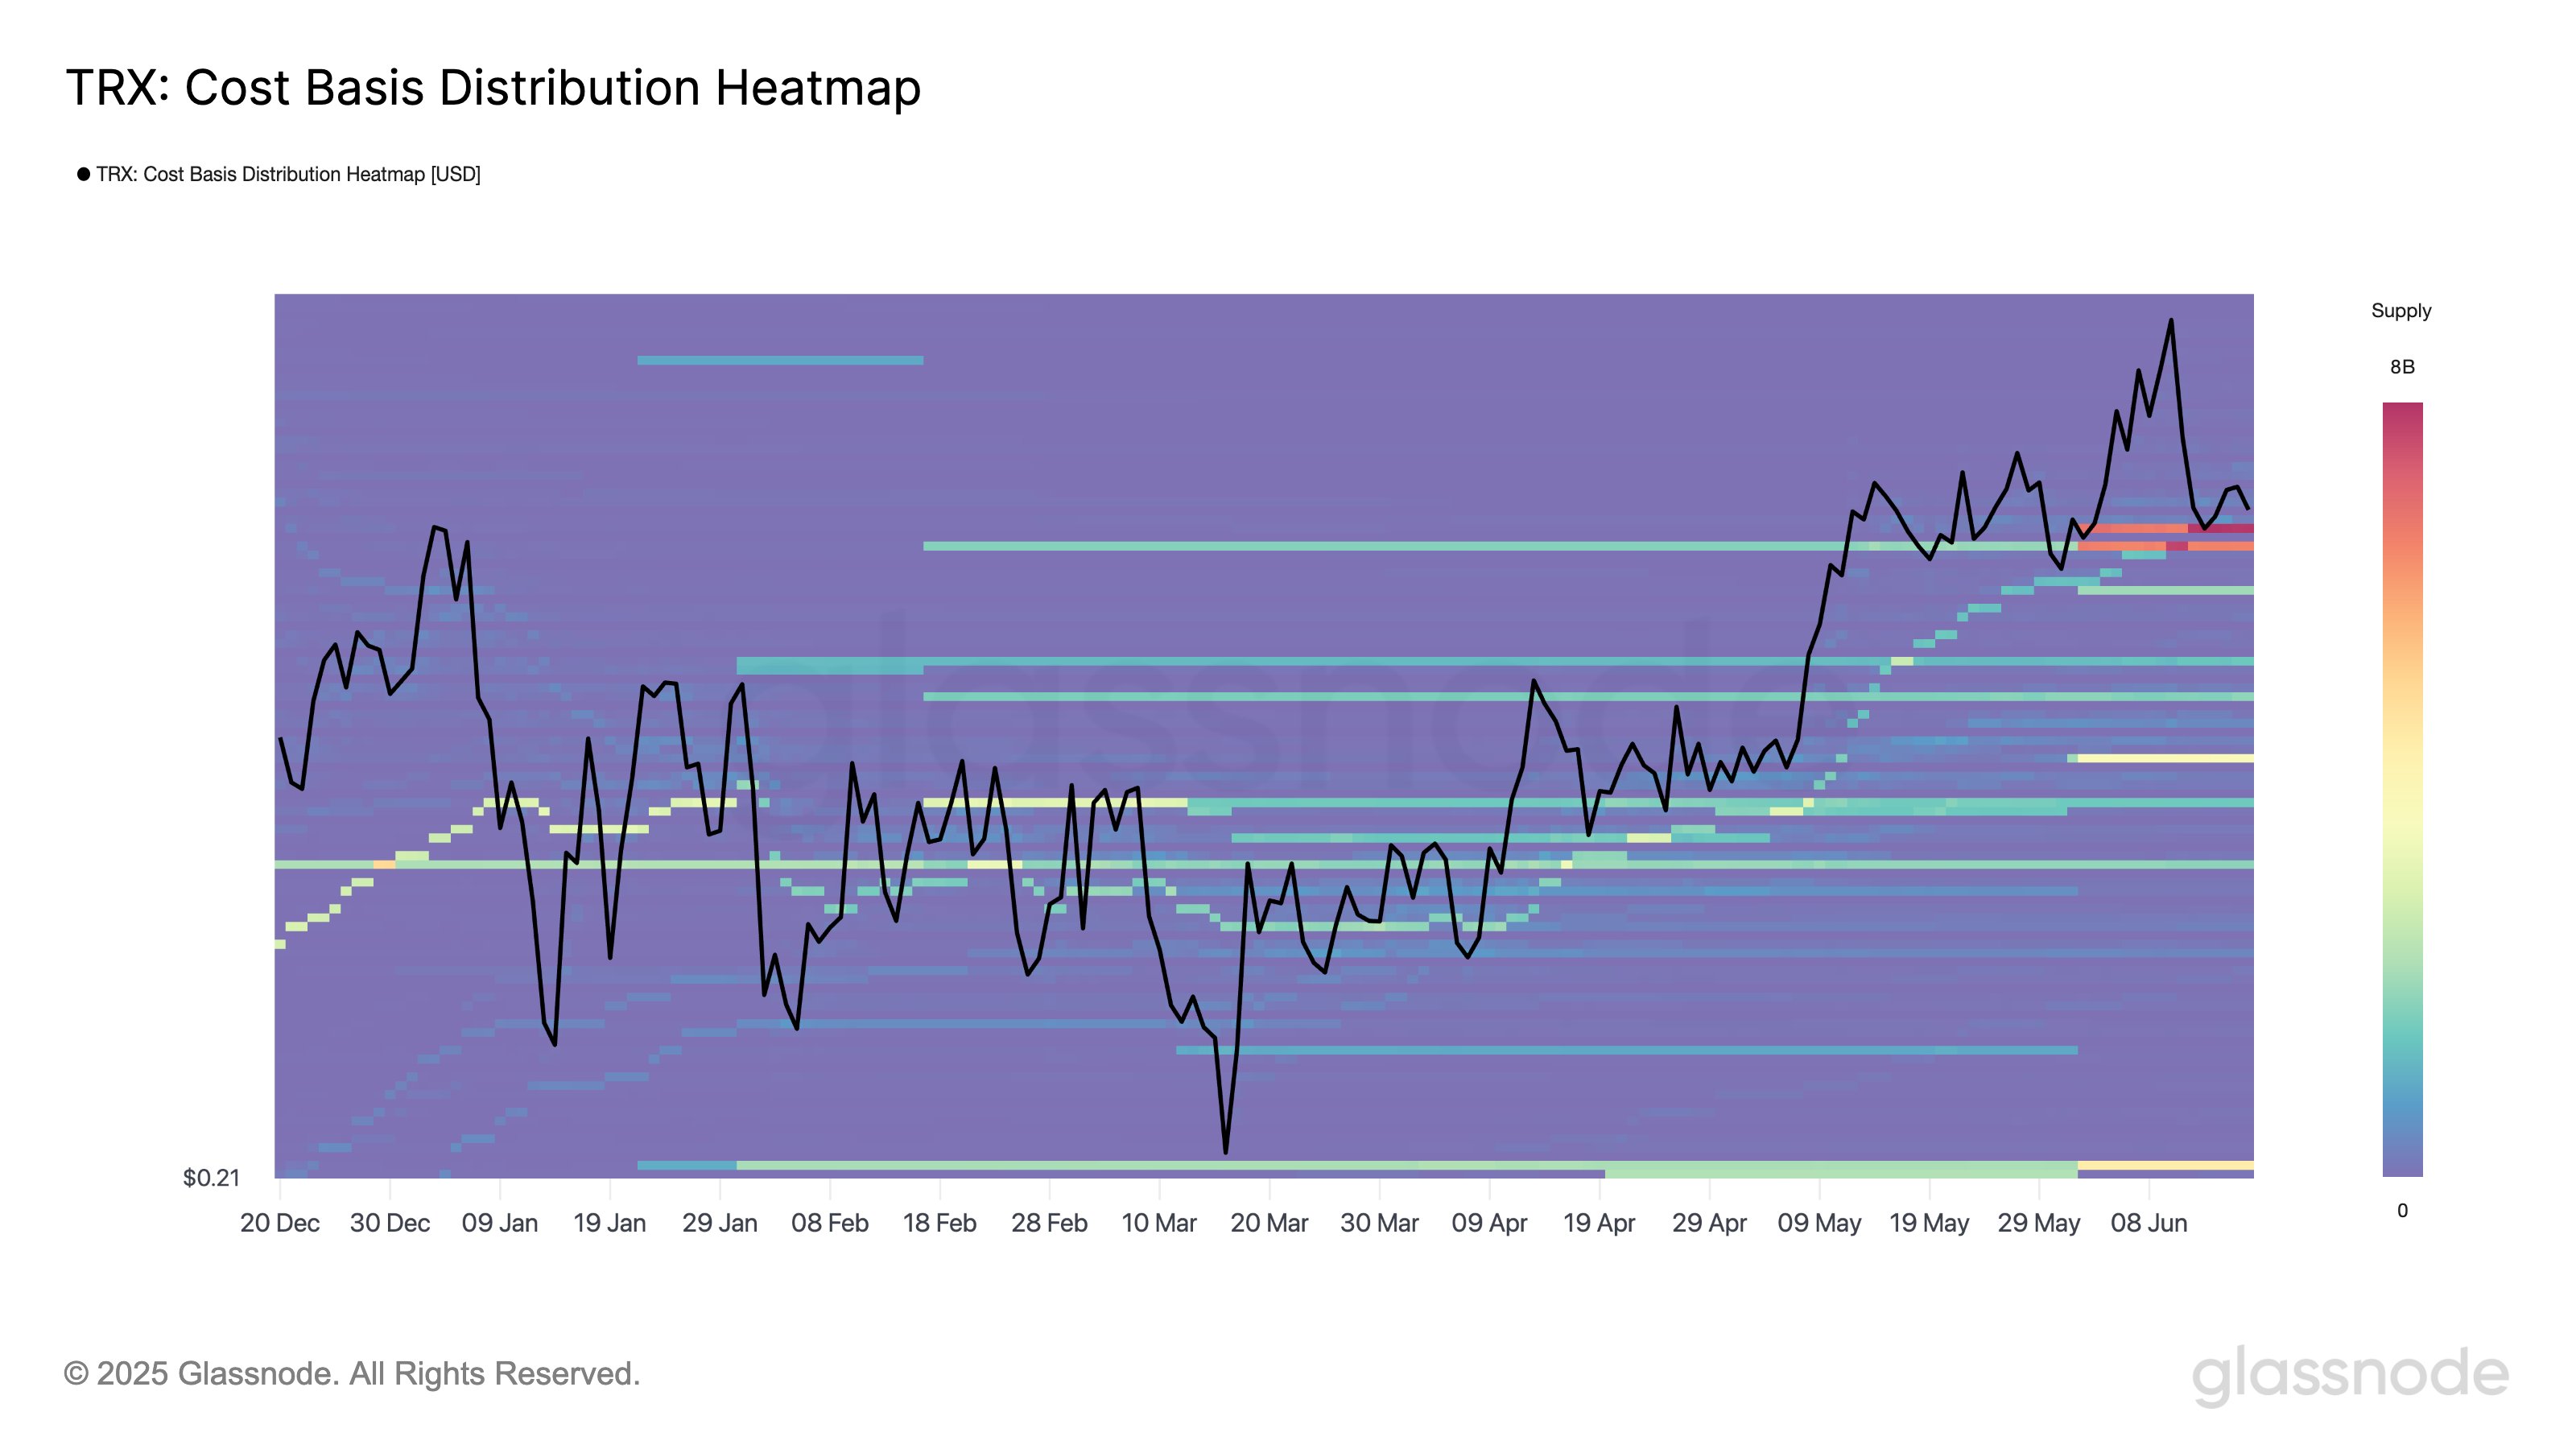
As Glassnode explains,
Cost Basis Distribution shows TRON found support in the $0.26–$0.27 range, where over 14B $TRX is held -marking the strongest cluster on the chart. Above that, the supply is relatively thin and most investor positioning remains below current price.
SOL Price
Solana is currently hanging right at the lower end of the support range as its price is floating around $145.

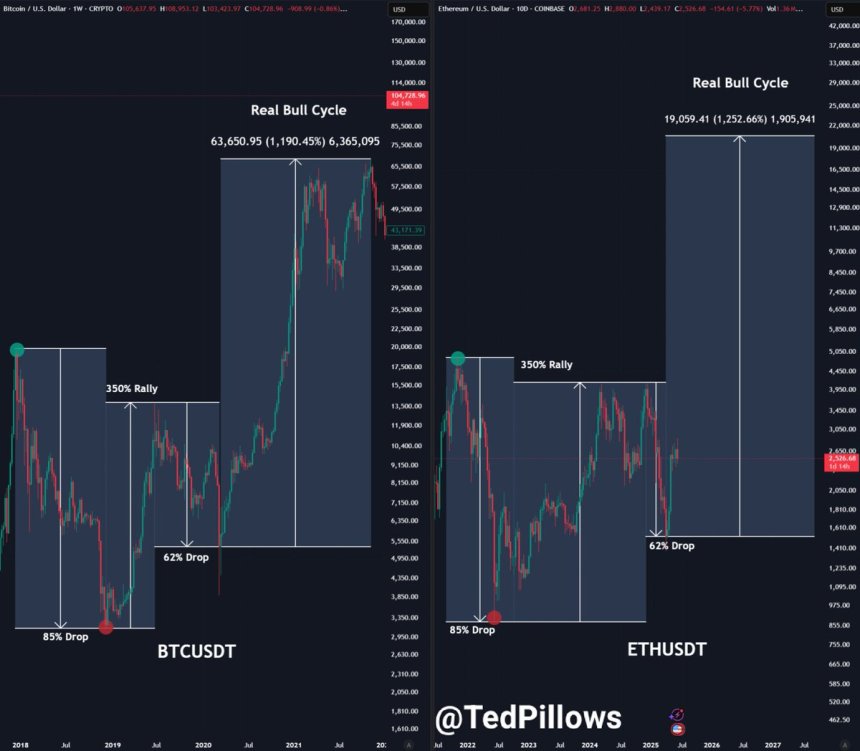
Ethereum Mirrors Bitcoin 2017-2021 Pattern – $4,000 Is The Trigger Point
Ethereum is trading within a tight range that has held for several weeks, forming the kind of compre...
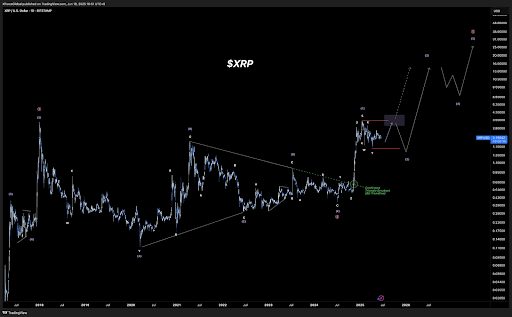
XRP 5-Wave Count Shows When The Price Will Hit All-Time Highs Above $5
Crypto analyst XForce has again alluded to the 5-Wave count to show when the XRP Price is likely to ...
Bitcoin Is The Purest AI Trade, Says Wall Street Veteran
Macro investor Jordi Visser has published a Substack essay arguing that Bitcoin is “the purest AI tr...