XRP Price Enters Perfect Setup After Buy Retest – Next Stop $3.7


The XRP price is reportedly positioning for a potential breakout as it forms a textbook Falling Wedge pattern, which a crypto analyst calls a perfect bullish setup . After a successful retest of a keg buy zone, technical indicators suggest that XRP is preparing for a powerful move toward the $3.7 level soon.
Falling Wedge Setup Signal XRP Price Breakout
XRP is currently entering what Robert Mercer, a TradingView crypto analyst, describes as the perfect breakout setup following a prolonged period of consolidation . This technical structure suggests that XRP could potentially experience a sharp rally from its current price of $2.25 to the $3.70 level.
Notably, on the 2-day XRP price chart , Mercer noted that the cryptocurrency has been consolidating within a Falling Wedge pattern since late December 2024. Since establishing a local bottom at $2.11 in the same timeframe, the altcoin has repeatedly tested this bottom level without breaking below it in a sustained manner.
The $2.11 price zone has also acted as a reliable horizontal support level throughout the six-month Falling Wedge formation. Meanwhile, XRP’s price action has been gradually compressing within the wedge pattern, indicating reduced volatility and increasing pressure near the wedge apex.
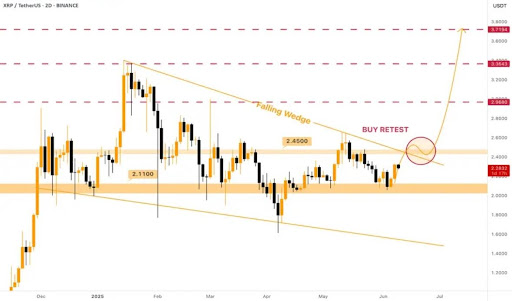
Looking at the TradingView analyst’s chart, it appears that XRP is now approaching the Falling Wedge resistance at the upper boundary, which coincides with the $2.45 level, where a buy retest has occurred. This convergence is viewed as a potential confirmation zone. If buying momentum continues and XRP closes decisively above $2.45, the breakout would confirm the end of the Falling Wedge and potentially initiate the cryptocurrency’s next upward move.
Mercer highlights that XRP’s current bullish structure is a simple yet perfect setup. And based on this setup, price targets above the wedge are projected in several stages, with $2.98, $3.36 and $3.71 serving as resistance levels based on historical price action and technical extensions. If the breakout holds and buying interest persists, the TradingView expert predicts that XRP may reach the $3.5 – $4 region over the next three to five months, aligning with past performances following similar wedge breakouts in the market.
$1.40 Breakdown Still In Play If Resistance Fails
While XRP’s current structure supports a bullish outlook, Mercer‘s price chart shows that a failed breakout remains a possibility. If XRP is rejected again at the $2.45 resistance level, it could resume its consolidation within the Falling Wedge pattern. This would place downward pressure on the price and may lead to a retest of lower support zones.
The most critical support level in this bearish scenario is located around $1.4. While this price level has not been tested directly in recent months, it marks the lower boundary of the Falling Wedge pattern. A breakdown below this level could invalidate the XRP’s wedge and bullish setup. It may also indicate a possible shift in market structure from consolidation to bearish continuation, which could result in further downside.

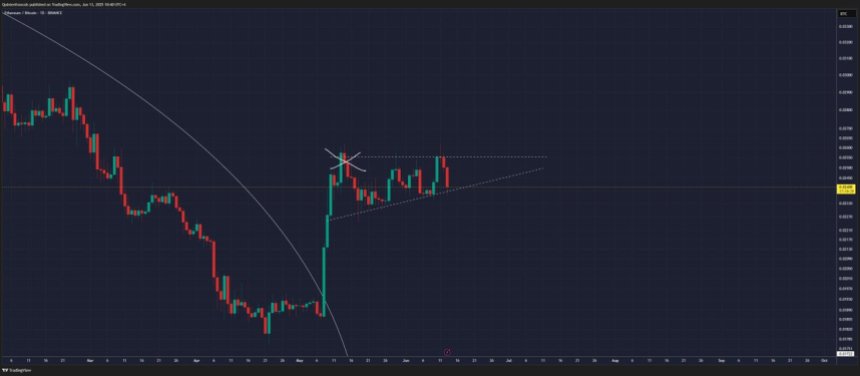
Ethereum Faces Stress As Israel-Iran Conflict Shakes Sentiment – ETH/BTC Support In Focus
Ethereum faced intense selling pressure earlier today as geopolitical tensions flared following Isra...

Bitcoin At $1 Million? CEO Says It’s The Price To Beat Gold
According to CNBC’s Power Lunch, Galaxy Digital CEO Mike Novogratz thinks Bitcoin could climb all th...
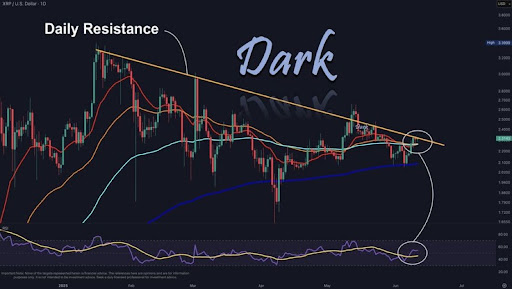
Daily Timeframe Says XRP Price Is On The Verge Of Breakout
The XRP price could be preparing for its biggest rally yet, as a crypto analyst now points to a pote...