Ethereum Price Sees Short-Term Correction—Healthy Dip or Warning Sign?


Ethereum price started a fresh increase above the $2,750 zone. ETH is now correcting gains and might test the $2,680 support zone.
- Ethereum started a fresh increase above the $2,800 level.
- The price is trading above $2,750 and the 100-hourly Simple Moving Average.
- There was a break below a key bullish trend line forming with support at $2,800 on the hourly chart of ETH/USD (data feed via Kraken).
- The pair could start a fresh increase if it stays above the $2,680 support in the near term.
Ethereum Price Corrects Gains
Ethereum price started a fresh increase after it found support near the $2,550 level, beating Bitcoin . ETH price was able to clear the $2,650 and $2,720 resistance levels.
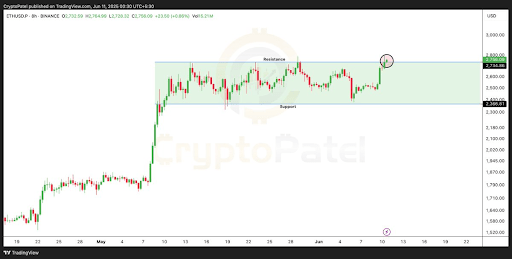
The bulls pushed the price above $2,800. ETH even spiked above $2,850. A high was formed at $2,880 and the price is now correcting gains. There was a move below the 23.6% Fib retracement level of the upward move from the $2,483 swing low to the $2,880 high.
Besides, there was a break below a key bullish trend line forming with support at $2,800 on the hourly chart of ETH/USD. Ethereum price is now trading above $2,750 and the 100-hourly Simple Moving Average.
On the upside, the price could face resistance near the $2,800 level. The next key resistance is near the $2,840 level. The first major resistance is near the $2,880 level. A clear move above the $2,880 resistance might send the price toward the $2,920 resistance.
An upside break above the $2,920 resistance might call for more gains in the coming sessions. In the stated case, Ether could rise toward the $3,000 resistance zone or even $3,120 in the near term.
More Losses In ETH?
If Ethereum fails to clear the $2,820 resistance, it could start a fresh decline. Initial support on the downside is near the $2,755 level. The first major support sits near the $2,680 zone and the 50% Fib retracement level of the upward move from the $2,483 swing low to the $2,880 high.
A clear move below the $2,680 support might push the price toward the $2,620 support. Any more losses might send the price toward the $2,550 support level in the near term. The next key support sits at $2,500.
Technical Indicators
Hourly MACD – The MACD for ETH/USD is losing momentum in the bullish zone.
Hourly RSI – The RSI for ETH/USD is now below the 50 zone.
Major Support Level – $2,680
Major Resistance Level – $2,880
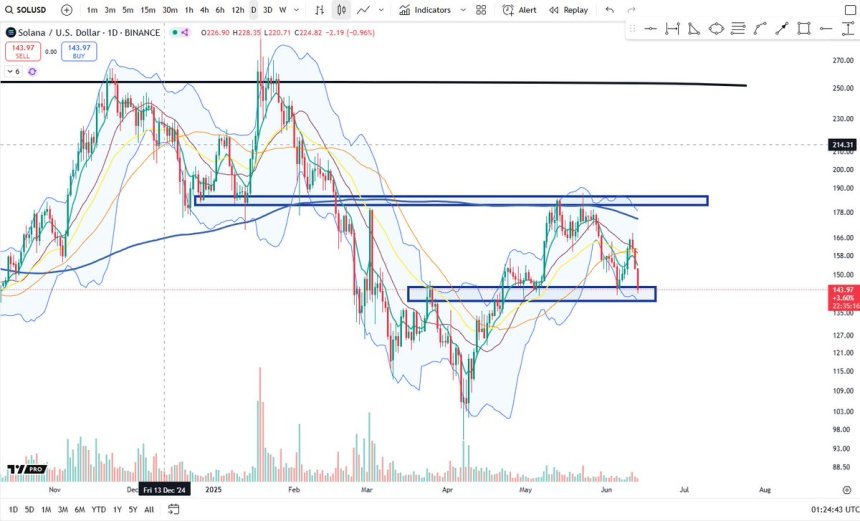
Solana Approaches Critical Support Amid Middle East Conflicts – Can Demand Hold?
After a volatile but bullish start to June, Solana (SOL) is now facing strong selling pressure amid ...
Ethereum Price Could Rally To $10,000 If This Major Resistance Is Broke
Ethereum’s price action this week has been very notable, with the leading altcoin breaking above $2,...
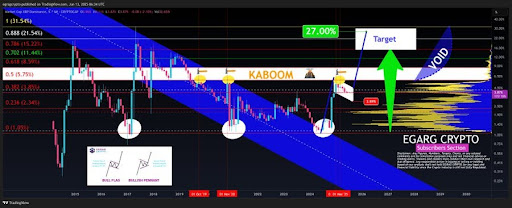
XRP Dominance Prepares To Shatter Fib 0.5 After 4 Historic Rejections
“Men lie, women lie, but charts and numbers do not lie,” EGRAG CRYPTO stated in a recent post on X, ...