Veteran Trader Predicts Double-digit XRP Next Target Based on This Historical Formation

Favorite
Share
Scan with WeChat
Share with Friends or Moments
A veteran trader has presented a three-week XRP outlook, analyzing historical price trends and Fibonacci levels to predict continued upward movement.
XRP has experienced a steady rise in price recently, reaching $2.32 from just below $2.10 on June 6. This marks a notable increase, with a 2.09% gain in the last 24 hours and a 3.94% rise over the past week.
As the crypto continues its upward trend, an analyst, Pepa, offers a detailed three-week outlook for XRP. He draws attention to historical price movements and Fibonacci levels that could potentially guide the asset's future path.
Pepa's 3-Week Price Analysis for XRP
Pepa, a crypto trader since 2013, has
presented
an intriguing three-week price analysis for XRP. He highlights a significant pattern that has emerged over time, resembling historical price movements dating back to 2014.
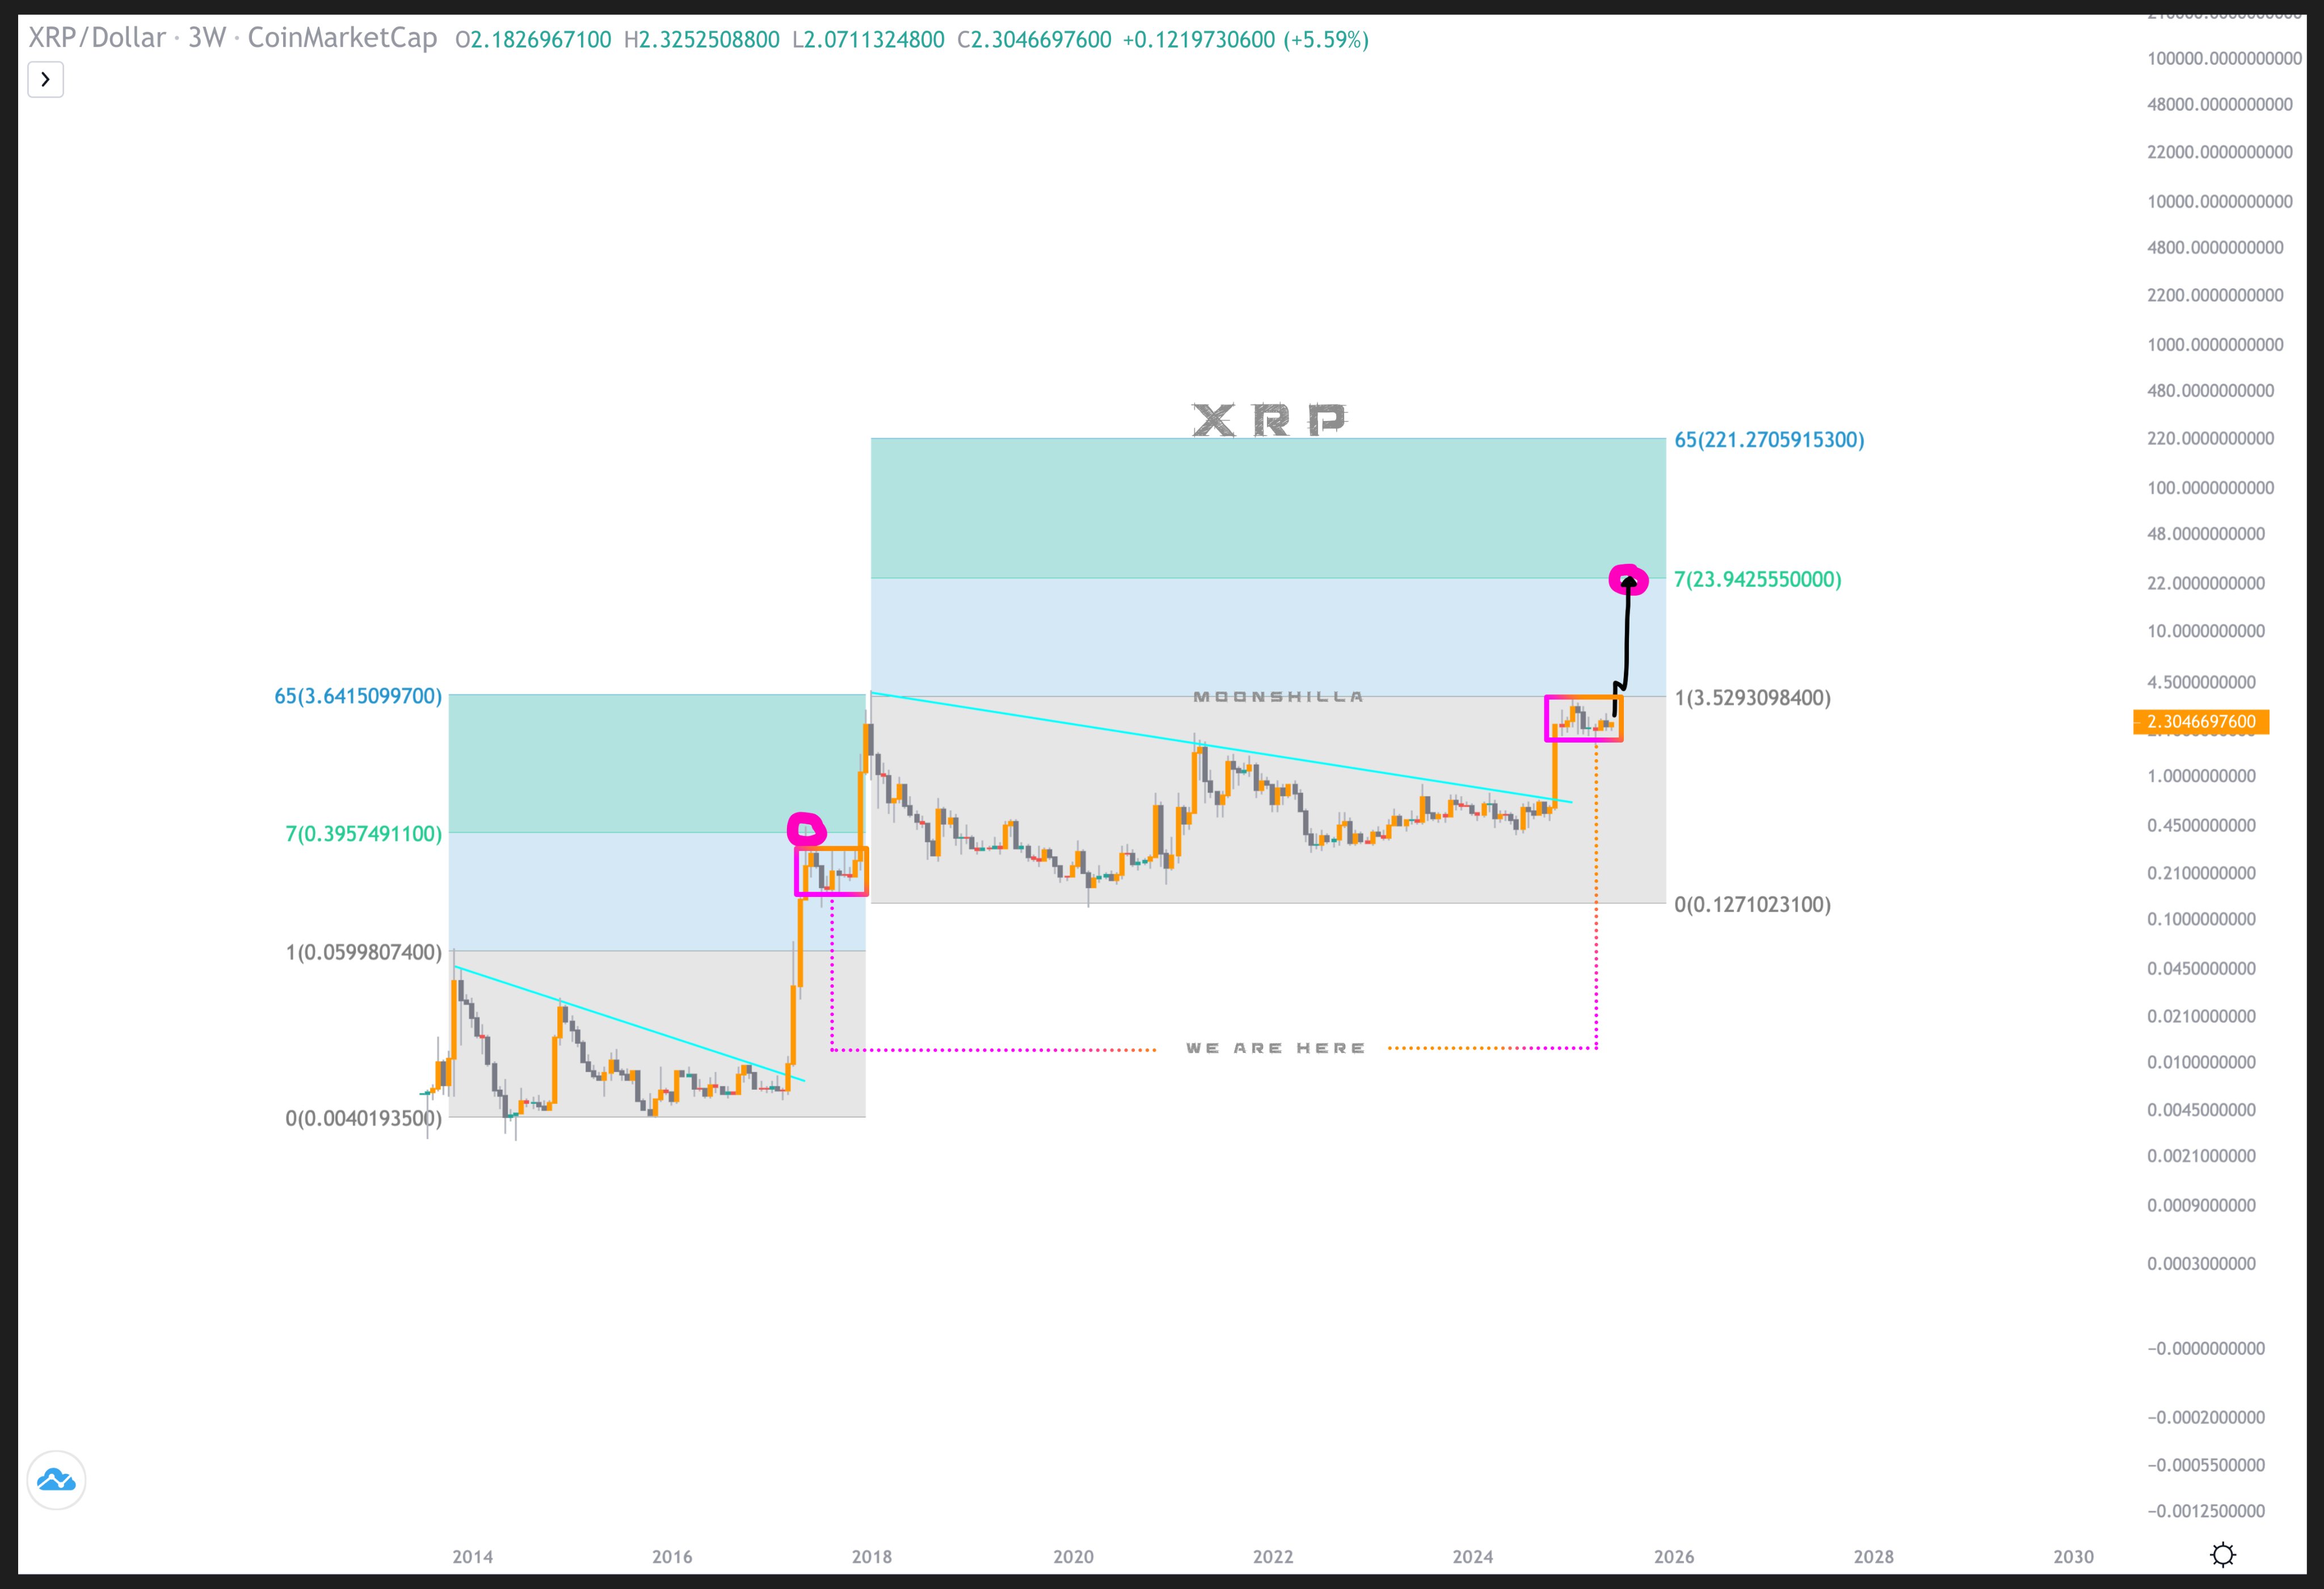 According to Pepa’s chart, XRP initially formed a descending trendline when its price peaked at $0.20 and then dropped to $0.004. This marked the 0 Fibonacci level, after which the price broke through the trendline and surged to $0.39 by May 2017. This surge, reaching the 7 Fibonacci level, was followed by further consolidation before XRP eventually soared to $3.4 by January 2018.
Pepa suggests that this same pattern has repeated in more recent years. Specifically, from a peak of $3.4 in 2018, another descending trendline formed, which capped XRP’s price action. The price then broke out in November 2024, surging to $3.4 by January 2025.
Now, XRP has slipped into another consolidation phase. Pepa expects the consolidation to end soon, projecting a continuation of the upward trend. He believes this continuation of the uptrend could eventually push XRP to the 7 Fibonacci level, around $23.94.
To reach this target, XRP would need to rise by approximately 931.9% from its current price of $2.32.
EGRAG Crypto’s Bullish Market Cap Forecast
Meanwhile, EGRAG Crypto, another market technician, is focusing on XRP's market cap chart, where he has
identified
a W pattern formation. This pattern, resembling a cup and handle structure, suggests that a breakout to the upside is imminent.
EGRAG presents a more conservative analysis of XRP's potential, forecasting a market cap target of $270 billion based on the W pattern’s measured move. This would correspond to an XRP price of around $4.5. However, in a more optimistic scenario, EGRAG also considers a logarithmic move that could push the market cap to $1.5 trillion, which would lead to an XRP price of $25.
According to Pepa’s chart, XRP initially formed a descending trendline when its price peaked at $0.20 and then dropped to $0.004. This marked the 0 Fibonacci level, after which the price broke through the trendline and surged to $0.39 by May 2017. This surge, reaching the 7 Fibonacci level, was followed by further consolidation before XRP eventually soared to $3.4 by January 2018.
Pepa suggests that this same pattern has repeated in more recent years. Specifically, from a peak of $3.4 in 2018, another descending trendline formed, which capped XRP’s price action. The price then broke out in November 2024, surging to $3.4 by January 2025.
Now, XRP has slipped into another consolidation phase. Pepa expects the consolidation to end soon, projecting a continuation of the upward trend. He believes this continuation of the uptrend could eventually push XRP to the 7 Fibonacci level, around $23.94.
To reach this target, XRP would need to rise by approximately 931.9% from its current price of $2.32.
EGRAG Crypto’s Bullish Market Cap Forecast
Meanwhile, EGRAG Crypto, another market technician, is focusing on XRP's market cap chart, where he has
identified
a W pattern formation. This pattern, resembling a cup and handle structure, suggests that a breakout to the upside is imminent.
EGRAG presents a more conservative analysis of XRP's potential, forecasting a market cap target of $270 billion based on the W pattern’s measured move. This would correspond to an XRP price of around $4.5. However, in a more optimistic scenario, EGRAG also considers a logarithmic move that could push the market cap to $1.5 trillion, which would lead to an XRP price of $25.
Disclaimer: This article is copyrighted by the original author and does not represent MyToken’s views and positions. If you have any questions regarding content or copyright, please contact us.(www.mytokencap.com)contact
About MyToken:https://www.mytokencap.com/aboutusArticle Link:https://www.mytokencap.com/news/511012.html
Previous:比特币以太坊凌晨最新行情走向分析6/12
Next:大饼以太多单成功止盈,后续可空?
Related Reading
Amazon and Walmart Exploring Launch of Their Own Stablecoins: Report
Two major retail giants, Walmart and Amazon, are reportedly exploring the launch of their dollar-peg...
SharpLink Gaming Acquires $463M in Ethereum, Becomes Largest Public ETH Holder
Nasdaq-listed SharpLink Gaming has made a groundbreaking move involving Ethereum as part of its trea...
Here Are Perfect Times to Buy and Sell Bitcoin Based on Halving Cycles
A prominent Bitcoin trader has suggested the perfect time for market participants to buy and sell BT...