Pi Network Faces Breakdown Risk: Will $0.60 Support Hold As Momentum Fades?


The post Pi Network Faces Breakdown Risk: Will $0.60 Support Hold As Momentum Fades? appeared first on Coinpedia Fintech News
In Breif
- Pi Coin (PI) is consolidating below $0.65 and nearing a critical support level at $0.60.
- Technical indicators, including RSI, MACD, and the Ichimoku Cloud, are signaling increasing downside pressure.
- Daily trading volume has dropped by over 90% since May, with on-chain engagement stalling.
- Scalping opportunities may still exist on the 4-hour timeframe, though broader sentiment remains cautious.
- All eyes are on Pi Day 2 (June 28), which is expected to determine the token’s short-term trajectory.
Technical Indicators Suggest Weakness
Pi Coin
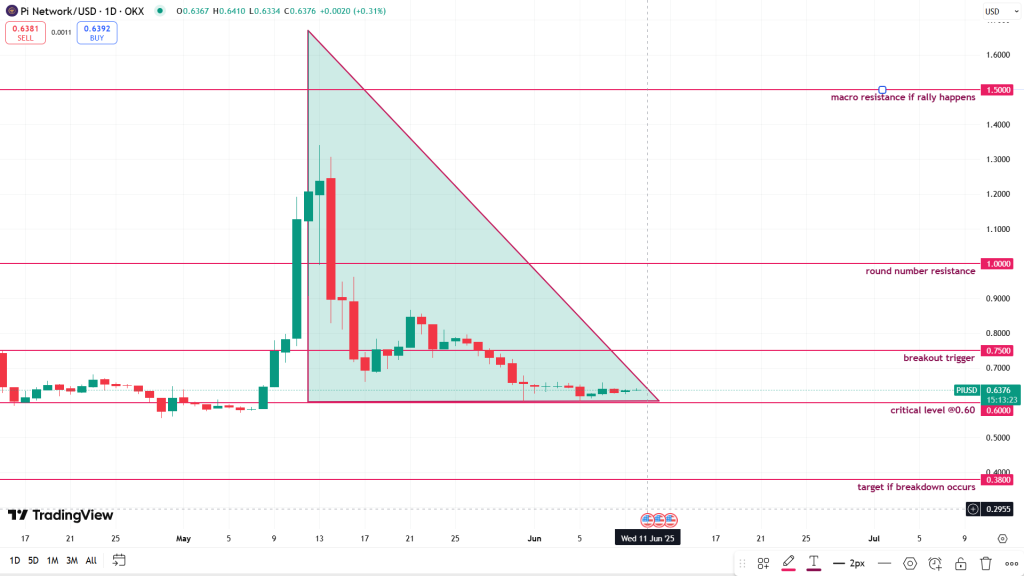
is trading just above a key support level at $0.60, with price action forming a classic descending triangle on the daily chart—a bearish continuation pattern.
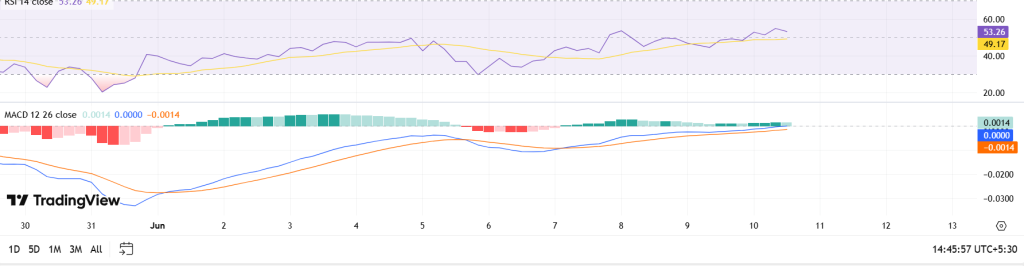
The Relative Strength Index (RSI) remains below 45 and is trending downward, indicating a lack of bullish strength. Meanwhile, MACD continues to print red histogram bars, highlighting prevailing bearish momentum.
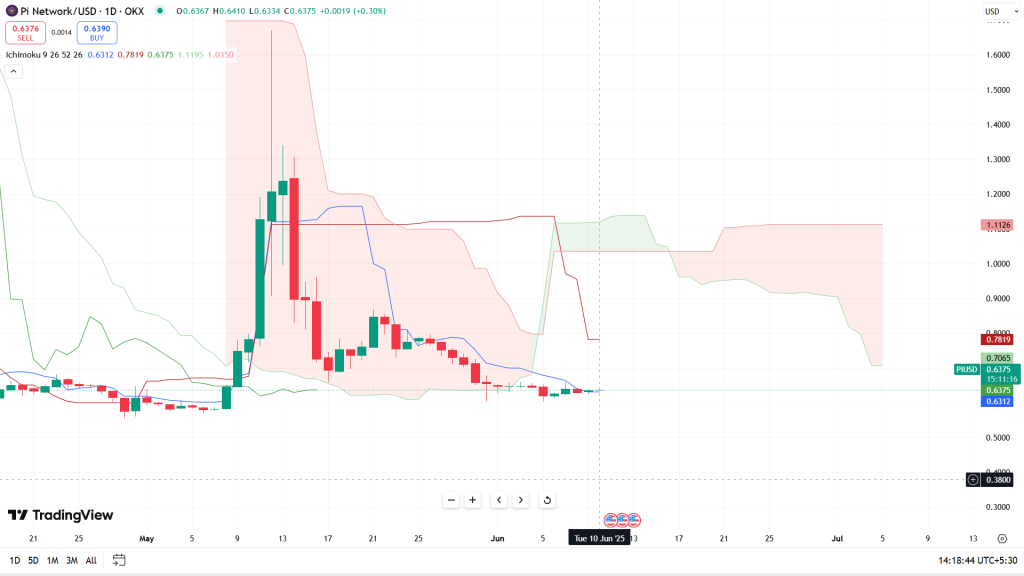
The Ichimoku Cloud analysis confirms this trend, with the price positioned below the Kumo, and the Chikou span lagging, both suggesting continued downward pressure.
Unless Pi breaks decisively above the descending trendline near $0.75, the technical setup favors a move below $0.60, with the next key support level at $0.38.
On-Chain Data Underscores Demand Drop
On-chain metrics reinforce the bearish outlook. According to Artemis data:
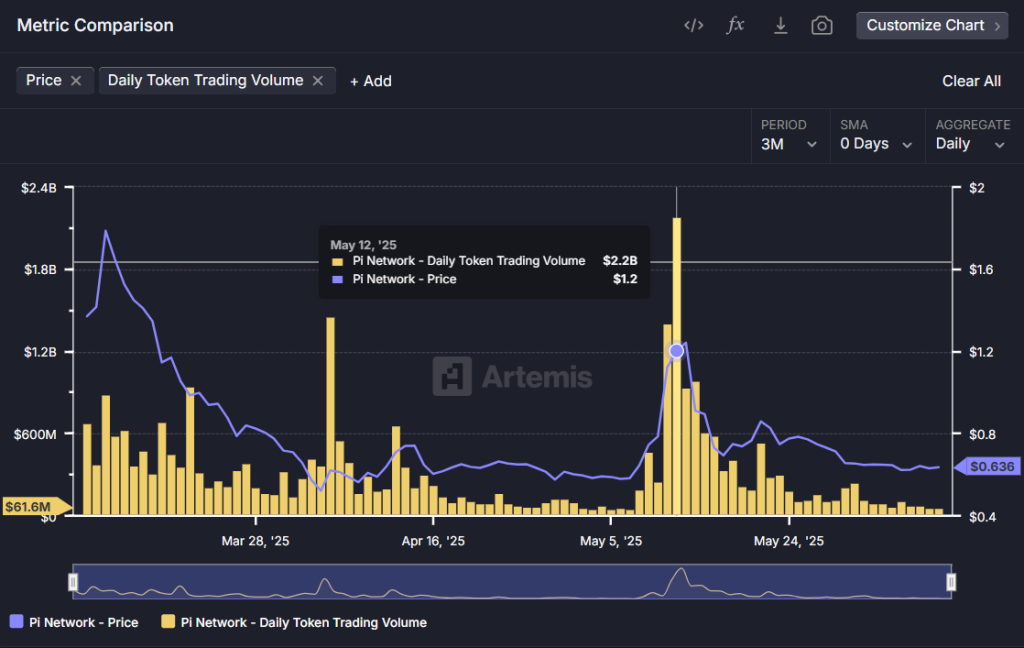
- Daily trading volume has plunged from over $2.2 billion in mid-May to under $62 million by June 10—a decline of more than 97 percent.
- The 24-hour trading volume to fully diluted market cap (FDMC) ratio has fallen to just 0.09 percent, reflecting low liquidity and waning speculative interest.
While a slowdown in supply release may be constructive in the long term, in the current environment it has not been enough to offset the lack of demand or improve price action.
Scalping Strategy on the 4-Hour PIUSDT Chart
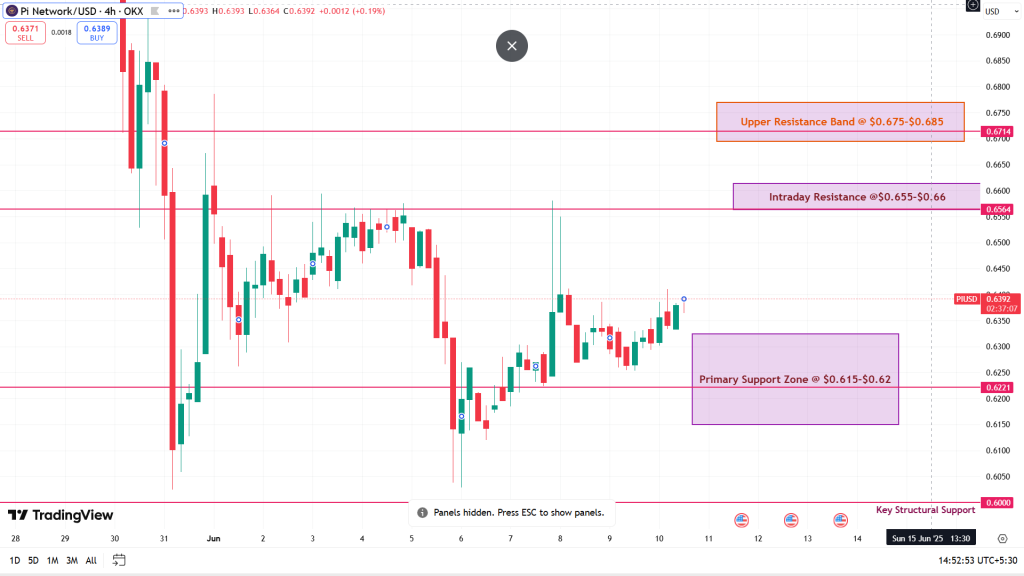
As of June 10, 2025, Pi Coin (PI/USDT) is trading around $0.6375 in a tight consolidation range between $0.62 and $0.66 on the 4-hour chart. Short-term indicators suggest mild bullish momentum building, though the broader trend remains uncertain.
The RSI (14) is currently at 53.36 , showing mid-level strength, while the MACD has formed a marginal bullish crossover (MACD: 0.0015, Signal: 0.0014). These indicators point to a potential setup for intraday scalping, particularly within well-defined price levels.
Long setups become favorable if RSI dips to the 35–40 zone and reverses upward, with a confirming MACD histogram flip to green and volume exceeding the 4-bar average. A recent example occurred on May 31 , when price rallied from $0.60 to $0.655 (+9%) after similar conditions.
Short setups can be considered if RSI approaches 63–65 and rolls over, accompanied by a MACD bearish crossover and high-volume rejection. This setup played out on June 4 , resulting in a drop from $0.665 to $0.625 (-6%).
Scalpers should maintain tight stop-losses (1.5–2%) and aim for quick exits at nearby resistance/support zones, focusing trades within the $0.62–$0.66 range until a breakout confirms a broader move
Pi Day 2: A Defining Event
The upcoming Pi Day 2 event on June 28 is expected to serve as a turning point for the project. The community is anticipating three key developments:
-
A clear timeline for the Open Mainnet, which is necessary for centralized exchange listings.
-
The unveiling of decentralized applications (DApps) and real-world merchant integrations.
-
Official clarification regarding the Global Consensus Value (GCV) of $314.159.
If these deliverables are met with substance, Pi could see a strong recovery, potentially testing $1.00 or higher. Conversely, if the event lacks clarity or results in vague promises, the price may lose its $0.60 footing, leading to a deeper correction.
Analyst Outlook: Short-Term Speculation
In the near term, Pi Coin stands at a pivotal level. With technical momentum fading and on-chain activity drying up, the most likely scenario is a period of sideways consolidation between $0.55 and $0.80 while the market awaits direction from the Pi Day 2 event.
A bullish breakout remains possible but is contingent on a strong, actionable roadmap, especially regarding mainnet deployment and exchange readiness. In that case, Pi could rally toward the $1.00 to $2.50 range. However, if expectations are not met or sentiment weakens further, a breakdown below $0.60 could send the token spiraling toward $0.50 or even $0.30.
At present, the evidence is bearish. The market is likely to remain in a holding pattern until clarity emerges from the Core Team.
Pi Coin Prediction: Short-Term Uncertainty Persist
Pi Network’s underlying architecture and mobile-first consensus model offer long-term potential, particularly with its large user base and community engagement. However, short-term challenges persist. Technical breakdown risks, a sharp fall in volume, and absence of listing momentum in top Exchnges like Binance place Pi Coin in a vulnerable position.
Until the Pi Core Team delivers tangible progress—especially on Open Mainnet timelines and ecosystem development—$0.60 remains the critical line separating recovery from rejection https://markets.coinpedia.org/pi/

Why MARA Stock Could Outperform Bitcoin in This Bull Market
The post Why MARA Stock Could Outperform Bitcoin in This Bull Market appeared first on Coinpedia Fin...

XRP News: Ripple to Launch EVM-Compatible Sidechain by Q2 2025
The post XRP News: Ripple to Launch EVM-Compatible Sidechain by Q2 2025 appeared first on Coinpedia ...

SAND Price Breakout: Is The Sandbox Gearing Up for a Major Rally?
The post SAND Price Breakout: Is The Sandbox Gearing Up for a Major Rally? appeared first on Coinped...