Crypto Bulls See $644M Bloodbath As Bitcoin Dips Below $105,000


Data shows a large number of long liquidations have occurred in the cryptocurrency market as Bitcoin and other assets have plunged.
Crypto Liquidations Have Surpassed $712 Million Over The Past Day
According to data from CoinGlass , chaos has occurred on the derivatives market following the volatility Bitcoin and the company have gone through during the last 24 hours.
Below is a table that shows how the liquidations have looked for the cryptocurrency sector within this window.
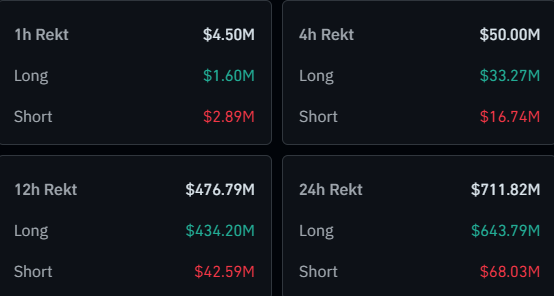
As is visible, almost $712 million in cryptocurrency contracts have seen forceful closure from their platform in the past day. About $477 million of these came during the last twelve hours alone.
Bitcoin and the altcoins, especially, have seen a decline in this period, so it’s not surprising to see that the liquidations have overwhelmingly affected the long investors. More specifically, the holders betting on a bullish outcome have been involved in more than 90% of the flush.
A mass liquidation event like this latest one is popularly known as a squeeze, and given the sharp imbalance toward the bulls, this particular event would be called a long squeeze . During a squeeze, a large amount of liquidations get triggered at once and feed back into the move that caused them. This unleashes a cascade of further liquidations, making such events quite volatile.
As for which of the individual tokens contributed the most to the long squeeze, the heatmap below shows it.
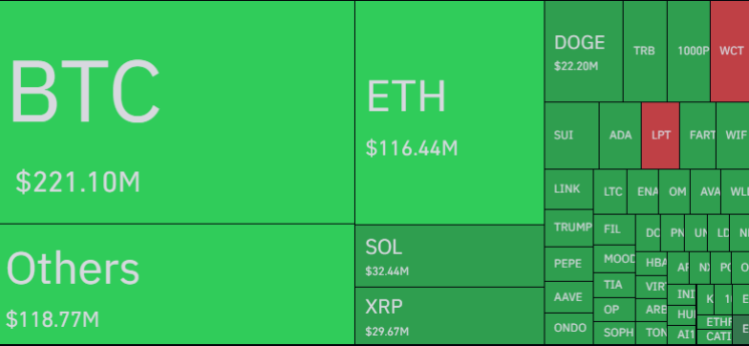
Bitcoin and Ethereum, the top two cryptocurrencies in terms of market cap, have also come out on top in this list, with the former observing liquidations of $221 million and the latter that of $116 million.
The third-ranked coin, however, hasn’t been XRP, but rather Solana, which is a couple of spots lower in terms of market cap. SOL’s $32 million in liquidations may be down to the fact that it has seen a larger decline than XRP.
While Bitcoin has seen a push down during the past day, its downfall actually started much earlier, with the high around $112,000 from May 22nd acting as the top so far. According to a report from the on-chain analytics firm Santiment, this peak coincided with a spike in whale activity.

The indicator displayed in the chart is the “ Whale Transaction Count ,” which tells us about how many whale-sized transfers are occurring on the BTC network every day.
It would appear that both versions of this metric (tracking transactions valued at more than $100,000 and $1 million) surged to a high level earlier in this month, a potential sign that profit-taking from these humongous entities forced Bitcoin toward a top.
Bitcoin Price
BTC saw a dip under the $105,000 level earlier in the day, but it appears the coin has since observed a small rebound as it’s now back at $105,800.

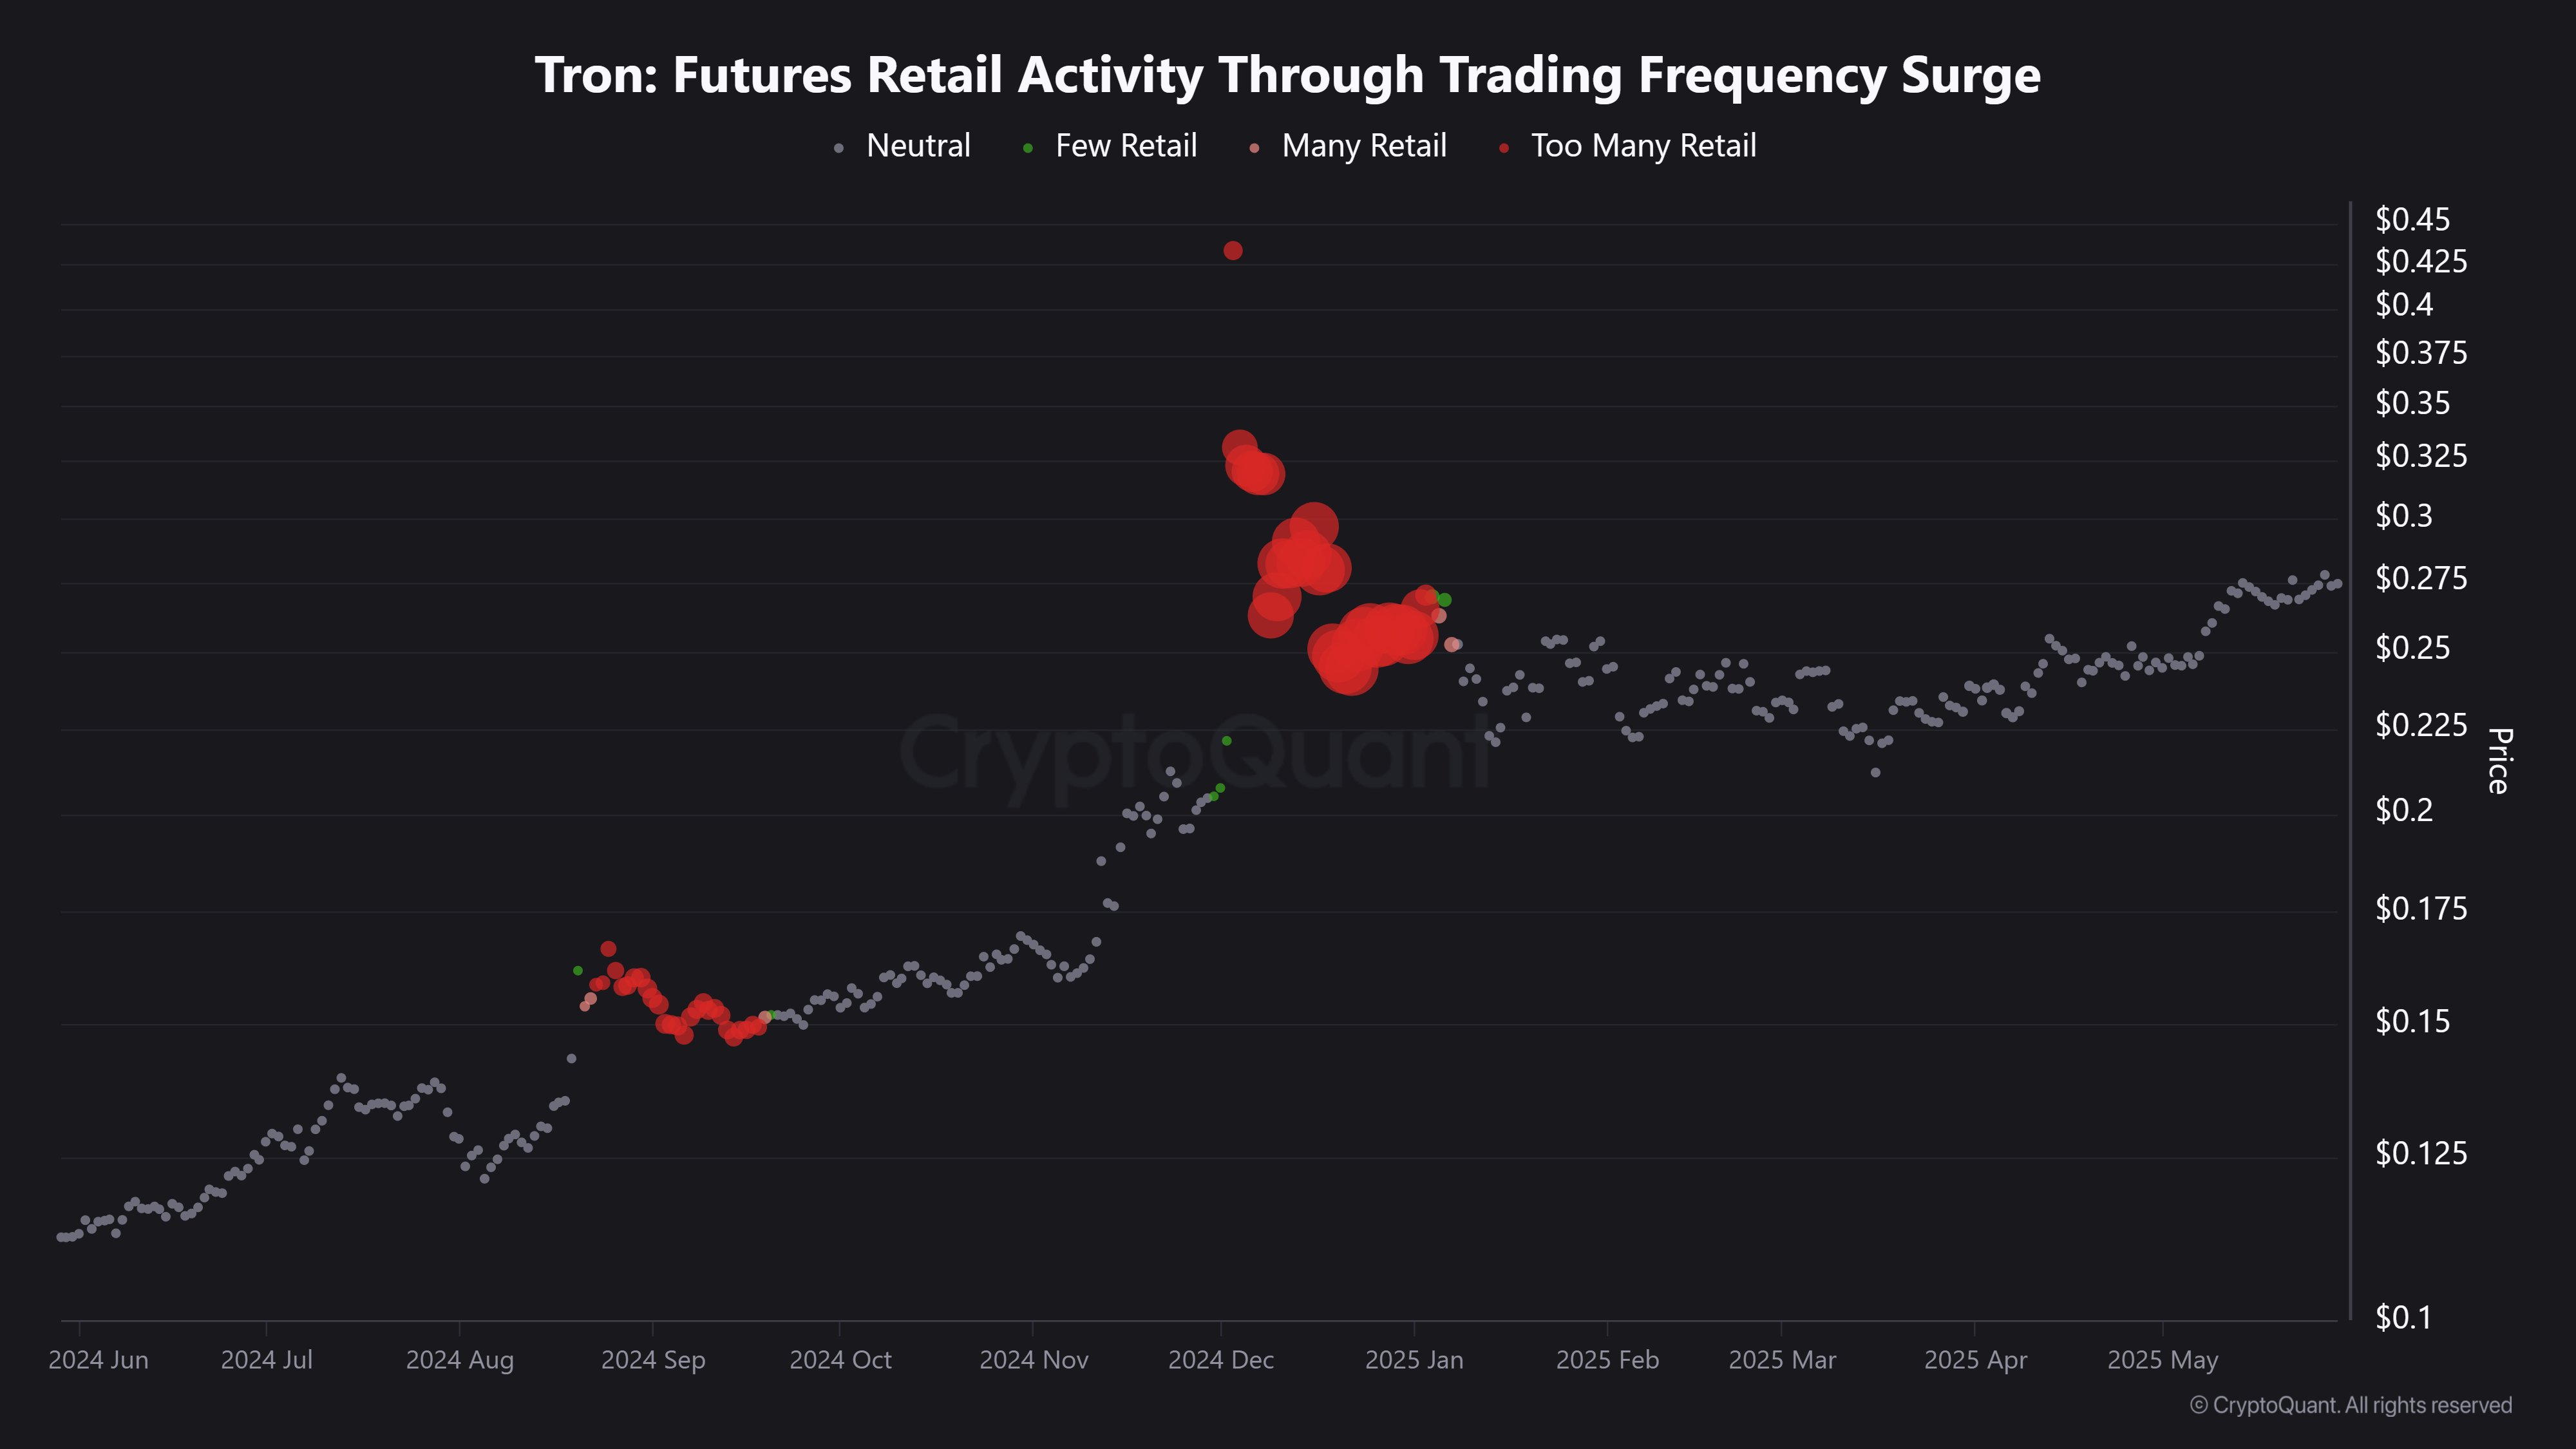
Tron (TRX) Future Retail Activity Indicates More Gains Ahead – Analyst
Over the past week, the Tron (TRX) market recorded a choppy price action, eventually resulting in a ...
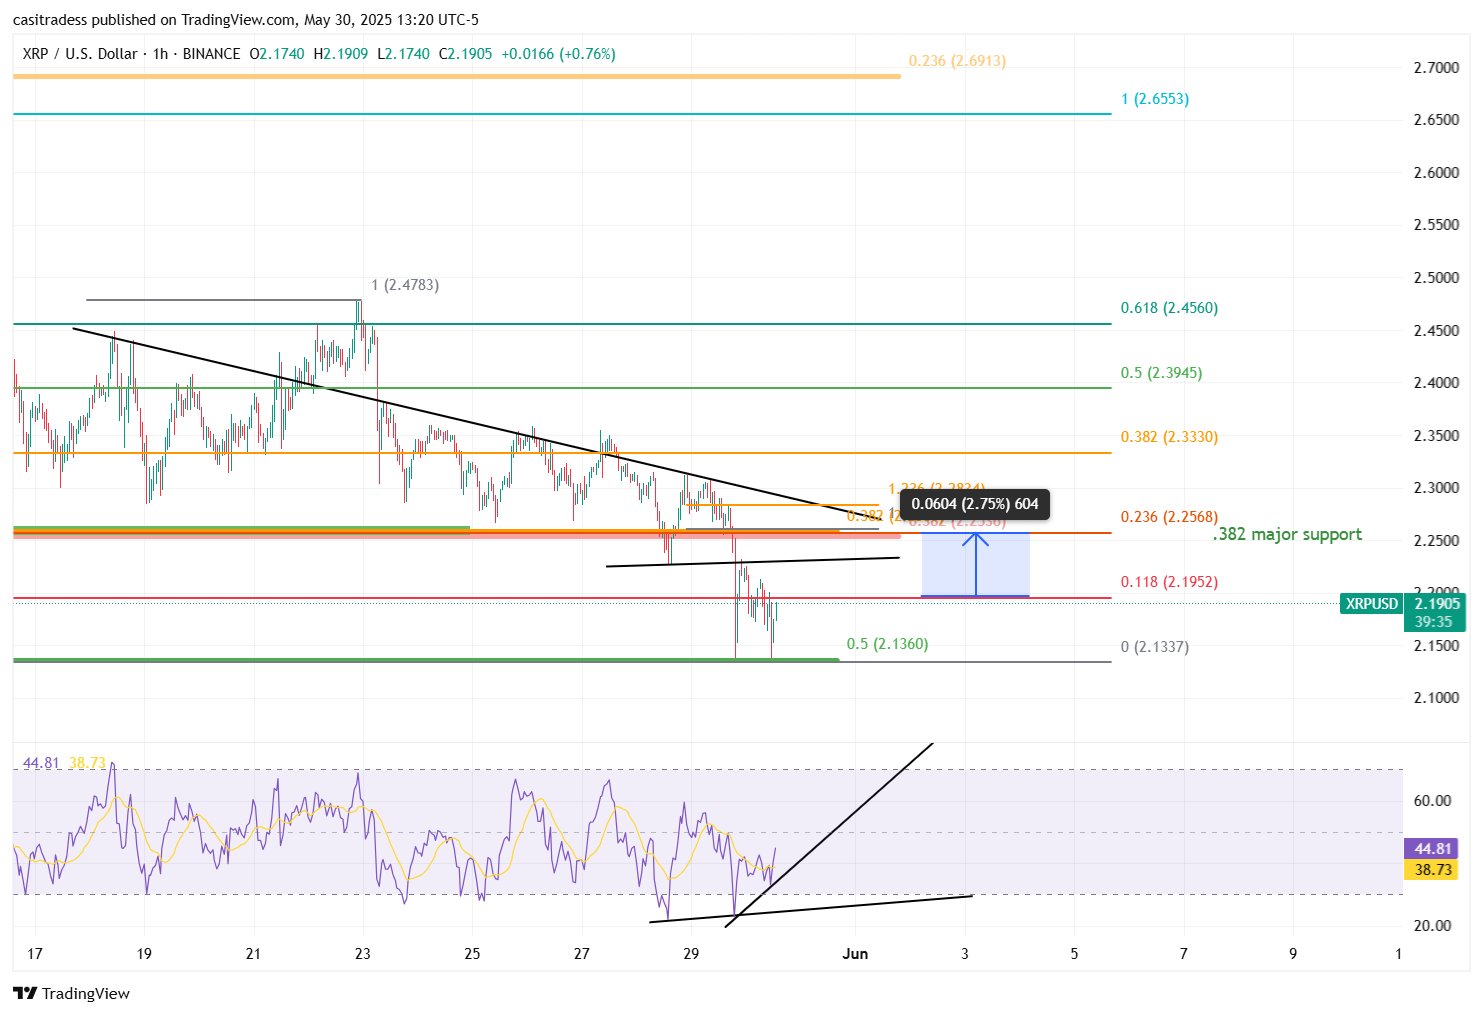
XRP Set For Price Relief, But Only If Bulls Defend Key $2.13 Price Level – Details
Popular crypto analyst with X username CasiTrades has shared an interesting technical analysis on th...

Pepe Makes It To Trump’s Feed—Is A Crypto Endorsement Next?
US President Donald Trump’s brief post on Truth Social on May 29 sparked a quick burst of excitement...