Cardano (ADA) Capped Below Resistance — Will Buyers Regain Control?


Cardano price started a fresh decline below the $0.80 zone. ADA is now consolidating and might aim for a recovery above $0.780.
- ADA price started a fresh decline below $0.80 and $0.780.
- The price is trading above $0.750 and the 100-hourly simple moving average.
- There was a break above a bearish trend line with resistance at $0.750 on the hourly chart of the ADA/USD pair (data source from Kraken).
- The pair could start another increase if it clears the $0.7840 resistance zone.
Cardano Price Eyes Recovery
In the past few days, Cardano saw a fresh decline below the $0.7550, unlike Bitcoin and Ethereum . ADA even declined below the $0.740 level before the bulls appeared.
A low was formed at $0.7287 and the price is now attempting a recovery wave. The price climbed above the $0.750 resistance level. There was a move above the 23.6% Fib retracement level of the recent decline from the $0.8380 swing high to the $0.7287 low.
There was a break above a bearish trend line with resistance at $0.750 on the hourly chart of the ADA/USD pair. Cardano price is now trading above $0.740 and the 100-hourly simple moving average.
On the upside, the price might face resistance near the $0.7680 zone. The first resistance is near $0.7840 or the 50% Fib retracement level of the recent decline from the $0.8380 swing high to the $0.7287 low. The next key resistance might be $0.80.
If there is a close above the $0.80 resistance, the price could start a strong rally. In the stated case, the price could rise toward the $0.820 region. Any more gains might call for a move toward $0.8350 in the near term.
Another Decline In ADA?
If Cardano’s price fails to climb above the $0.7680 resistance level, it could start another decline. Immediate support on the downside is near the $0.750 level.
The next major support is near the $0.740 level. A downside break below the $0.740 level could open the doors for a test of $0.7260. The next major support is near the $0.70 level where the bulls might emerge.
Technical Indicators
Hourly MACD – The MACD for ADA/USD is gaining momentum in the bullish zone.
Hourly RSI (Relative Strength Index) – The RSI for ADA/USD is now above the 50 level.
Major Support Levels – $0.750 and $0.740.
Major Resistance Levels – $0.78400 and $0.8000.
Analyst Predicts Big Drop For Bitcoin Price As Bearish Pressures Mount After $111,000 ATH
Bitcoin is showing signs of fatigue after reaching a new all-time high of $111,814 on May 22. Since ...

US Crypto Market Structure Bill Is Finally Here: Will It Start an Altcoin Rally?
The House of Representatives has introduced the Digital Asset Market Clarity Act, which looks to ado...
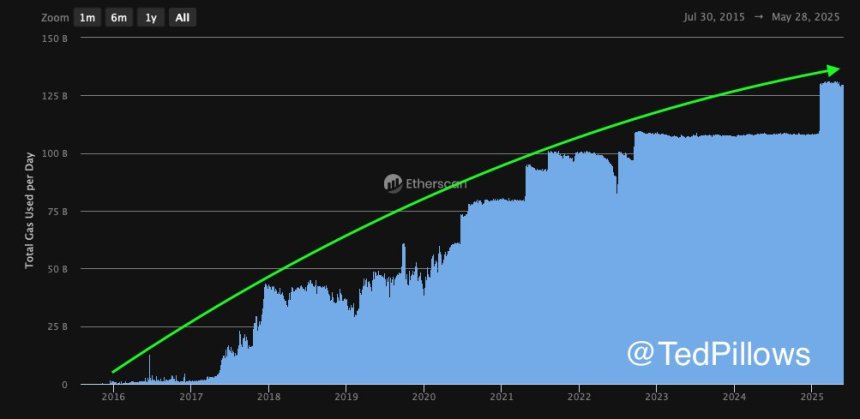
Ethereum Daily Gas Usage Hits New Highs – Real Demand Powers ETH Growth
Ethereum is experiencing increased volatility as it consolidates just below the key $2,700 resistanc...