Dogecoin Breakout Incoming? $3 Target On The Horizon—Analyst


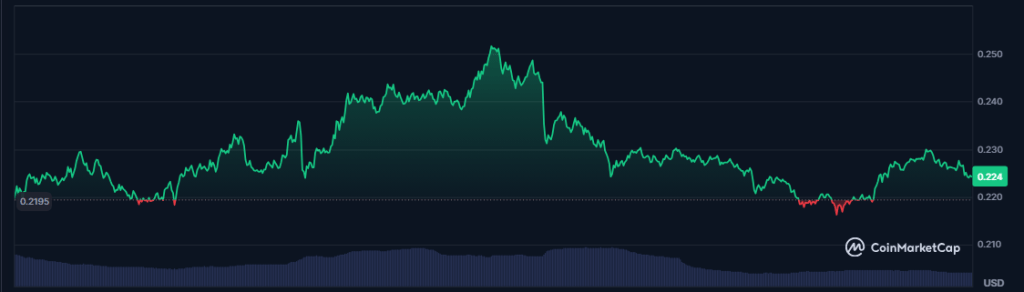
Dogecoin has held steady above $0.22 since May 20 and climbed back after a brief dip. It hit $0.25 on May 23, then eased into the weekend. In the last 24 hours, the token is up 4.1%. Over a week, it’s up 5%, even though it slipped midweek.
The Triangle Pattern
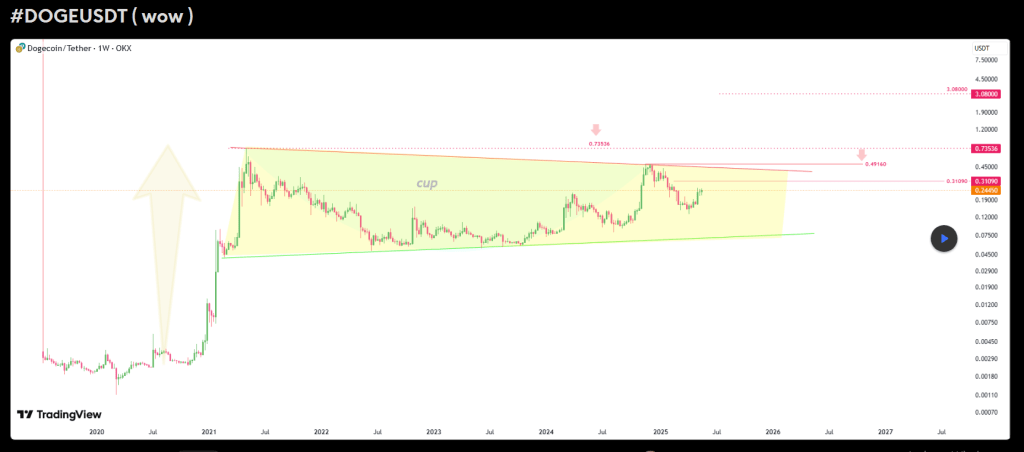
According to TradingView analyst Akbar Karimzsfeh, Dogecoin has been tracing a long, tightening triangle since its all-time high of $0.73536 on May 3, 2021. That peak was followed by a drop to $0.048 on June 13, 2022. Since then, every attempt to break lower—on June 5, August 14 and October 9 of 2023—has failed. The lines of the triangle are closing in. When they meet, a sharp move is likely.
Key Resistance Levels
Based on data , the upper trendline of the triangle also matches the top of a large “cup” pattern around $0.4916. There was an attempted breakout in December 2024, and prices almost hit that $0.4916 mark but got pushed back. After that, DOGE slid down to $0.13. It has since recovered some ground, but it still has to clear that $0.4916 hurdle before bulls can claim real control.
Dogecoin hovered around $0.22 between May 20 and May 26. It peaked at $0.25 on May 23, only to slip afterward. Then the last 24-hour gain of 4.1% showed it can bounce from support. The 5% weekly rise points to steady buying, even with some pullbacks in the middle of the week. Traders are watching for a daily close above $0.50 as a sign that the long squeeze is over.
 On-Chain Metrics Rise
On-chain data backs up the price action. New addresses have jumped by 102.40% in the past seven days. Active addresses climbed 111.32%. Zero balance addresses went up 155.45%. That suggests more people are sending small amounts of DOGE or testing the network. It doesn’t guarantee they’re holding long term, but it does flag higher interest and activity.
If Dogecoin can break above the top trendline and hold above $0.49, some see a move toward $3.08. That target is based on adding the triangle’s height to the breakout point. It’s a big leap. Psychology and trading fees could slow that run. But the pattern says a strong move may be coming.
Based on reports, caution is still wise. Wait for clear confirmation before betting on a moonshot. A slip below the lower trendline near $0.05 would turn the picture bearish. For now, Dogecoin sits in the balance, squeezed between two key trendlines. Traders and fans will be watching every close above $0.49 or fall below $0.05 to gauge the next big move.
Featured image from Gemini Imagen, chart from TradingView
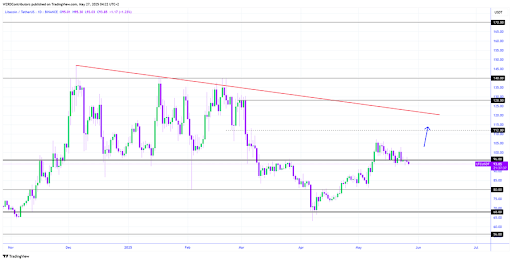
Indecisive Close For Litecoin, But The Real Story Lies In BTC.D’s Next Move
Litecoin (LTC) wrapped up the day with an indecisive close, leaving traders on the edge of their sea...
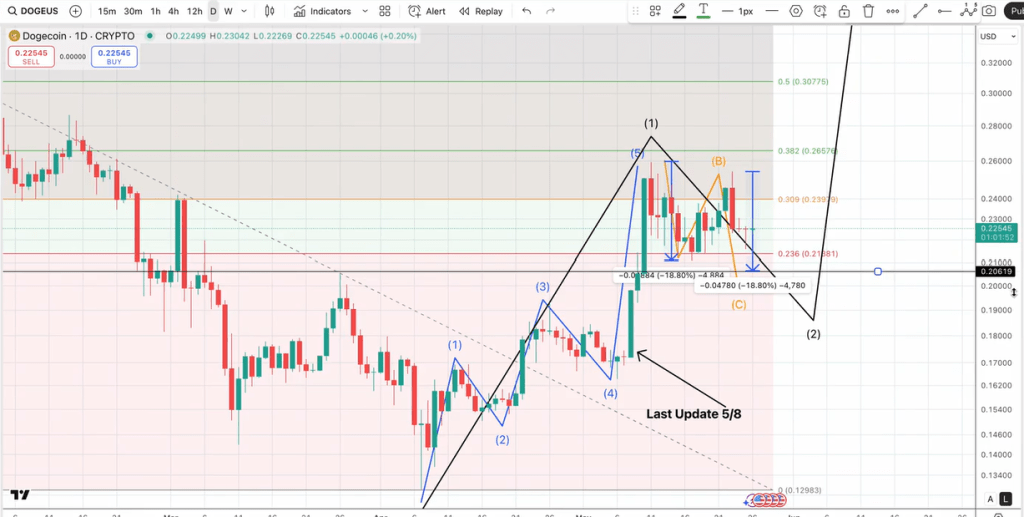
Dogecoin Enters Danger Zone — Chartist Predicts Sharp Drop Ahead
Dogecoin slipped toward the lower end of its month-long range on Tuesday as independent chartist Qua...
Bitcoin Retraces Below $109,000: Analysts Split on Future Outlook
The market’s leading crypto, Bitcoin (BTC), has experienced a retracement below the $109,000 mark on...