Cardano (ADA) In Focus: Can It Break This Barrier and Reclaim Momentum?


Cardano price started a fresh increase above the $0.7250 zone. ADA is now consolidating and facing hurdles near the $0.760 zone.
- ADA price started a decent increase above $0.7250 and $0.7320.
- The price is trading above $0.740 and the 100-hourly simple moving average.
- There is a key bearish trend line forming with resistance at $0.7580 on the hourly chart of the ADA/USD pair (data source from Kraken).
- The pair could start another increase if it clears the $0.760 resistance zone.
Cardano Price Eyes Upside Break
In the past few days, Cardano saw a fresh increase from the $0.710 level, but it underperformed Bitcoin and Ethereum . ADA was able to clear the $0.7250 and $0.7320 resistance levels.
The price cleared the 50% Fib retracement level of the recent decline from the $0.7762 swing high to the $0.7110 low. However, the price is now approaching a couple of key hurdles on the upside, starting with $0.7580. There is also a key bearish trend line forming with resistance at $0.7580 on the hourly chart of the ADA/USD pair.
Cardano price is now trading above $0.740 and the 100-hourly simple moving average. On the upside, the price might face resistance near the $0.7580 zone and the trend line.
The first resistance is near $0.760 or the 76.4% Fib retracement level of the recent decline from the $0.7762 swing high to the $0.7110 low. The next key resistance might be $0.7720. If there is a close above the $0.7720 resistance, the price could start a strong rally. In the stated case, the price could rise toward the $0.80 region. Any more gains might call for a move toward $0.8250 in the near term.
Another Decline In ADA?
If Cardano’s price fails to climb above the $0.760 resistance level, it could start another decline. Immediate support on the downside is near the $0.7420 level.
The next major support is near the $0.7260 level. A downside break below the $0.7260 level could open the doors for a test of $0.710. The next major support is near the $0.680 level where the bulls might emerge.
Technical Indicators
Hourly MACD – The MACD for ADA/USD is gaining momentum in the bullish zone.
Hourly RSI (Relative Strength Index) – The RSI for ADA/USD is now above the 50 level.
Major Support Levels – $0.7420 and $0.7260.
Major Resistance Levels – $0.7600 and $0.8000.
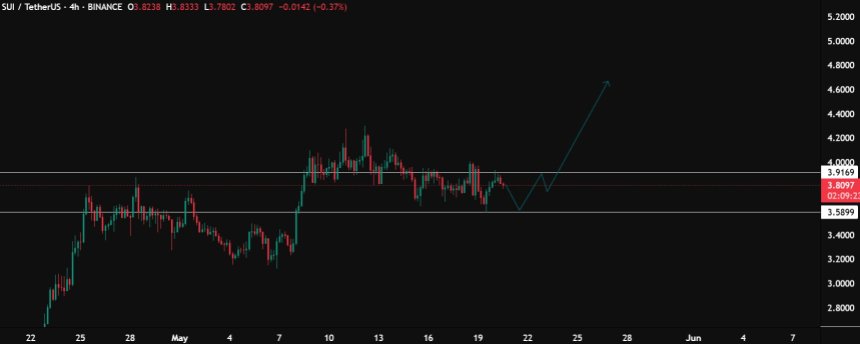
SUI Preparing For Another Leg Up – Is $5 The Next Target?
After its breakout, SUI has been consolidating within a key range and has faced momentary resistance...
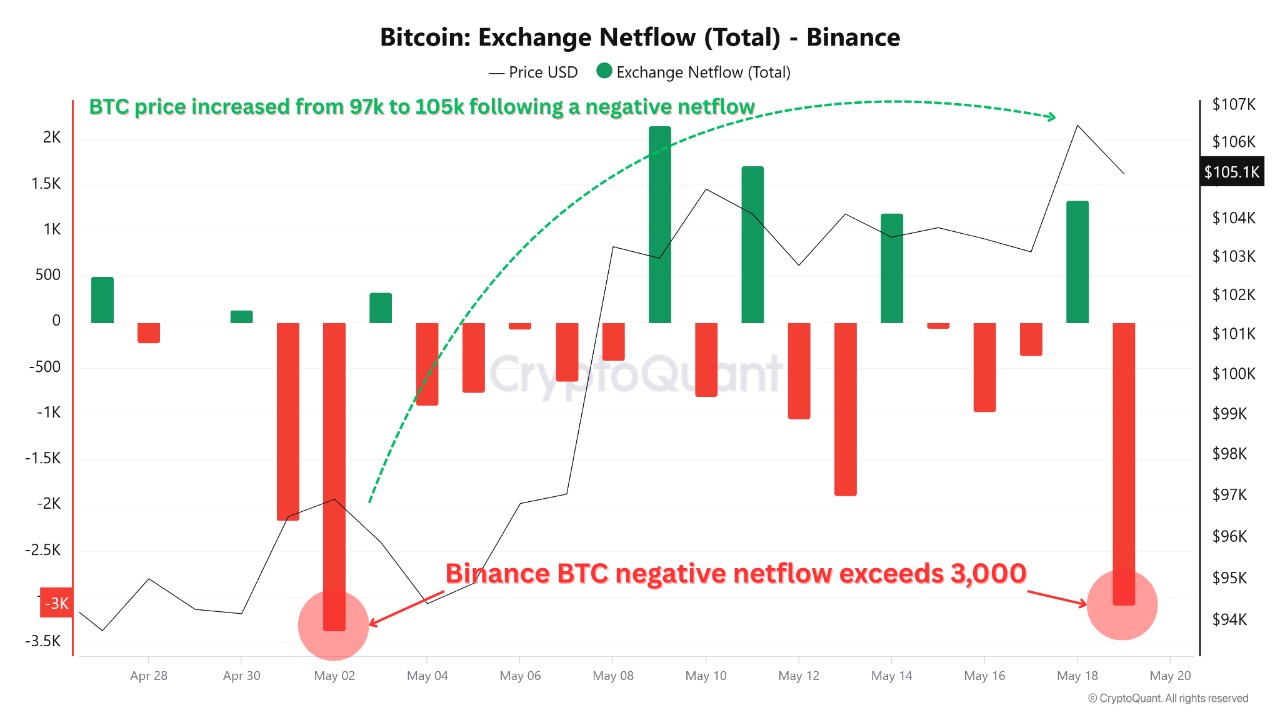
Binance Bitcoin Outflows and MVRV Ratio Point to Sustained Bullish Setup, Analyst Reveals
Bitcoin (BTC) has seen a slight retreat after reaching an intraday high of $106,704. At the time of ...
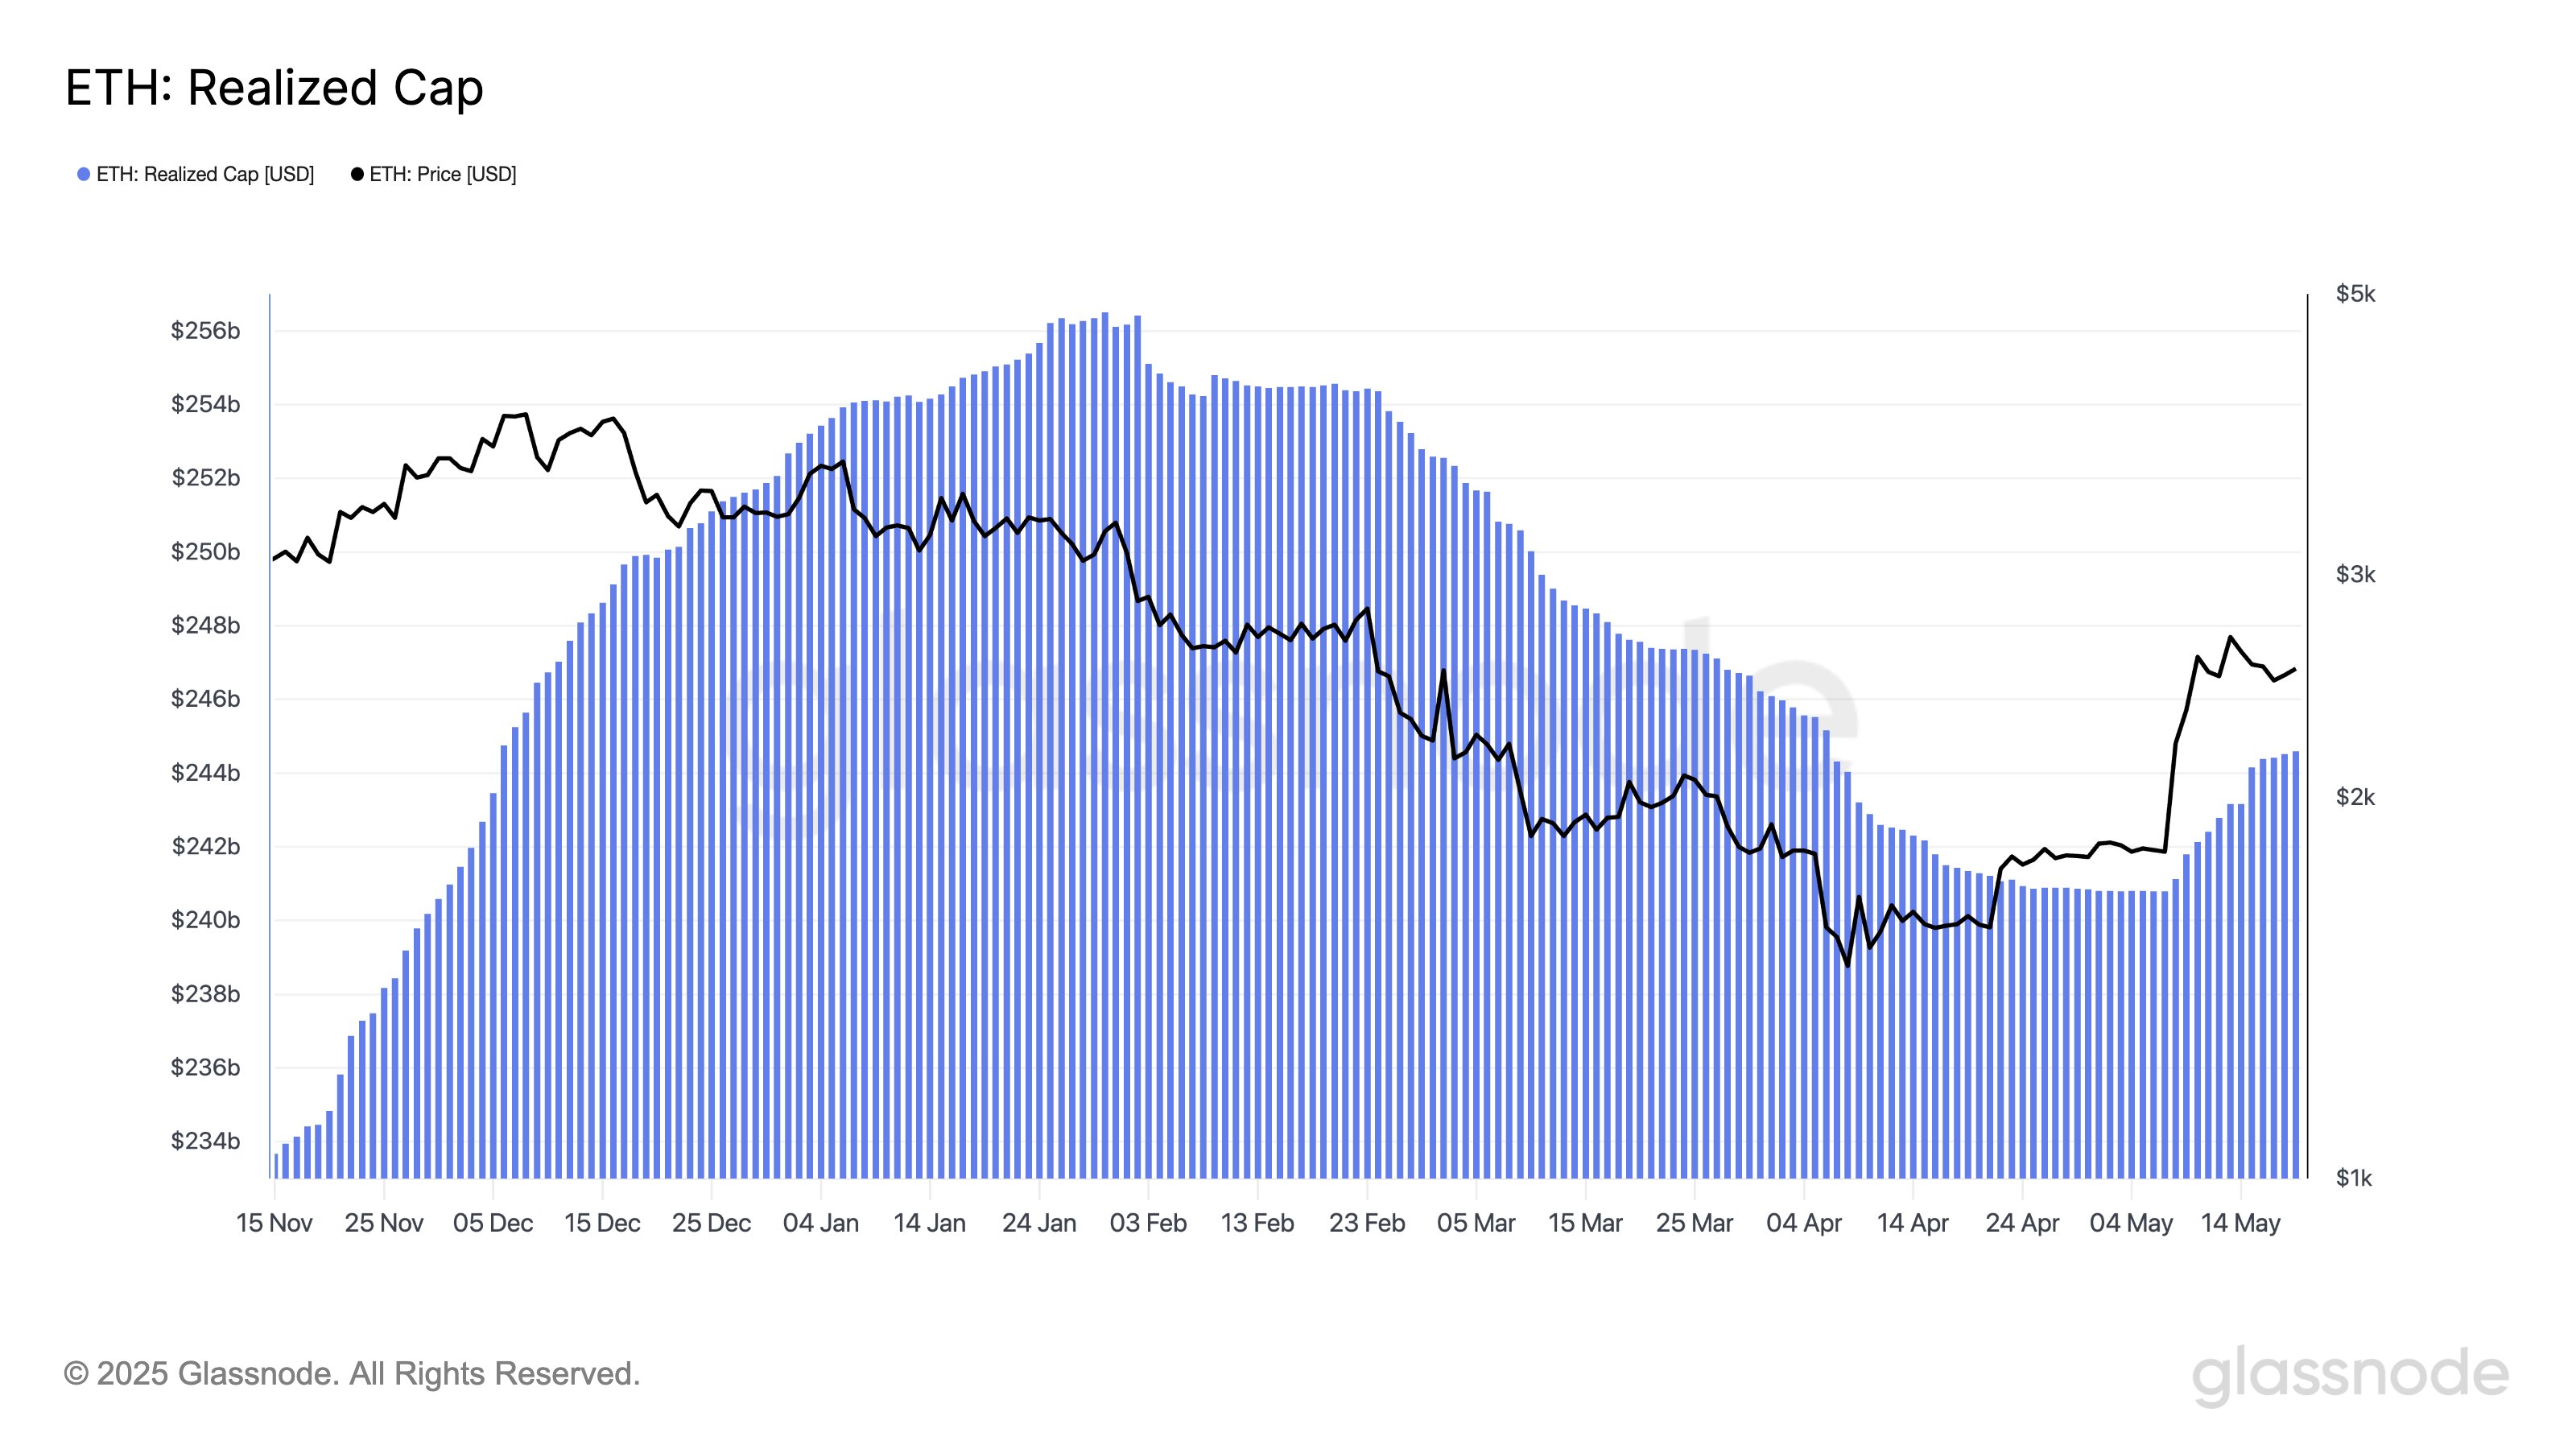
$3.8 Billion In Capital Inflows Behind Ethereum’s Post-Pectra Surge, Data Shows
On-chain data shows Ethereum has seen a significant rise in its Realized Cap recently, signaling the...