AAVE Price Climbs 118% in 6 Weeks, Can The Rally Break Above $300


The post AAVE Price Climbs 118% in 6 Weeks, Can The Rally Break Above $300 appeared first on Coinpedia Fintech News
Key Highlights:
- AAVE surged 118% from $121.75 to $265 since April 9.
- The team launched Aave v3 on Aptos today (May 19), expanding to a non-EVM Layer 1.
- Technicals show a parabolic rally , but momentum indicators are cooling.
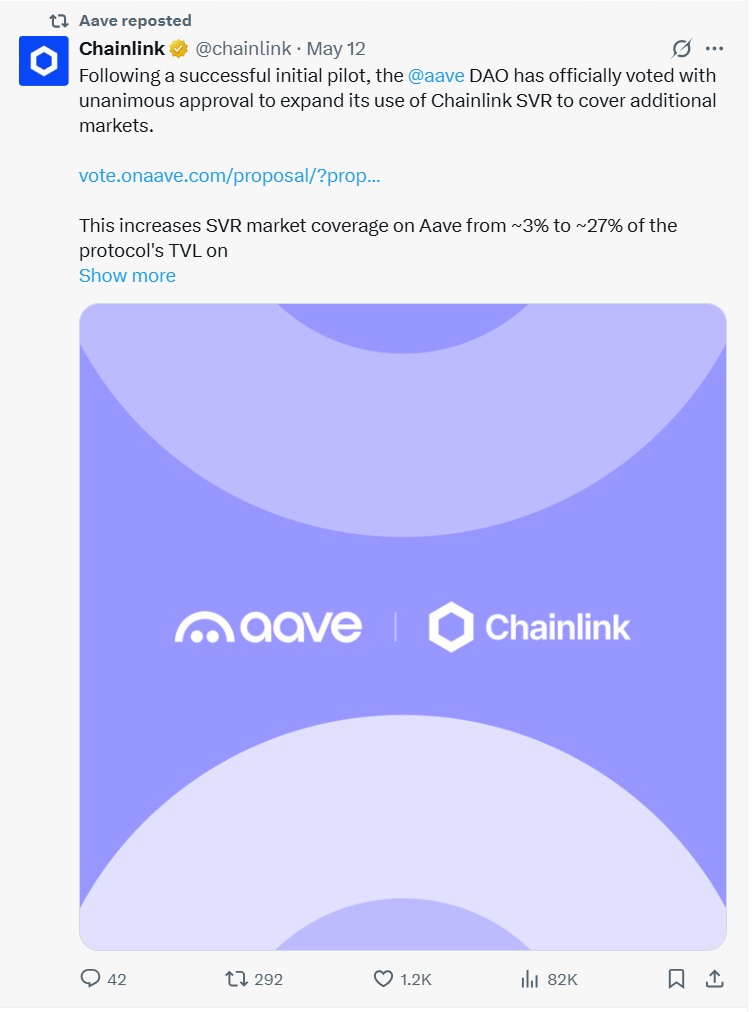
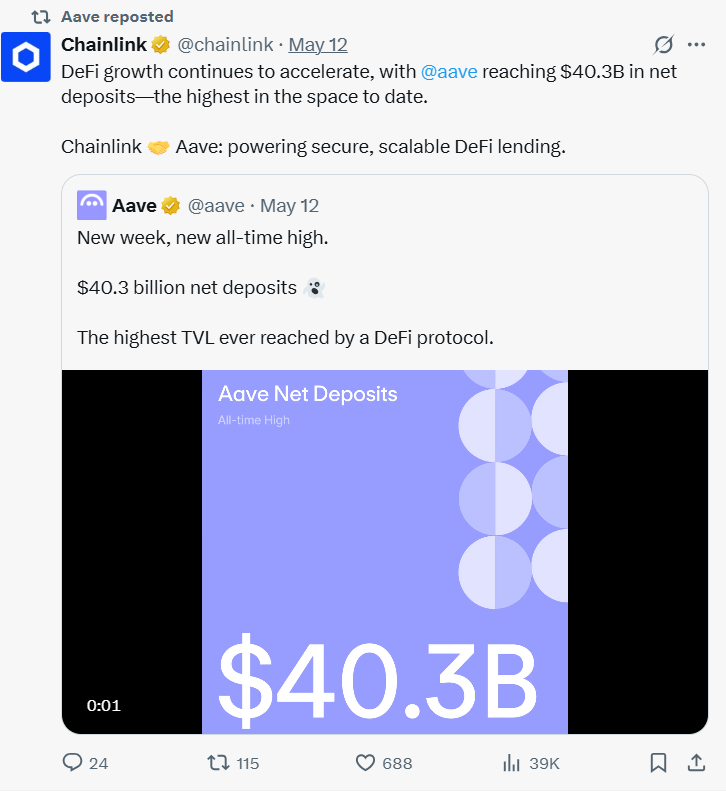
- AAVE’s TVL hit $40.3B , with Chainlink SVR coverage expanded from 3% to 27%.
- On-chain metrics reveal over 80% of tokens and active users are in profit , supporting the rally.
AAVE Coin surged over 118% in the past 6 weeks — and now enters its 7th week of gains. With bullish technicals, will momentum sustain or is a cooldown ahead?
Recent Developments: Ecosystem Growth Reinforces Rally
In the past two weeks, Aave has made significant strides to strengthen its ecosystem. On May 12 , the Aave DAO approved the expansion of Chainlink’s Secure Value Recovery (SVR) mechanism. This resulted in boosting TVL coverage from just 3% to over 27%.
This move enhances the protocol’s risk mitigation and positions Aave as a more secure lending platform.
Followed May 19 , the team officially launched Aave v3 on Aptos , marking its first deployment on a non-EVM chain. This cross-chain expansion taps into a new user base and enhances liquidity flexibility for developers and lenders operating beyond Ethereum.
At press time AAVE price trades at $264.71 , up 20.35% in 24 hours , with 24-hour volume surging to $808.39M (+66.97%) and a market cap of $4B . Conitnues Reinforcing strong demand post-announcements.
AAVE/USDT Parabolic Rally Nears Major Resistance
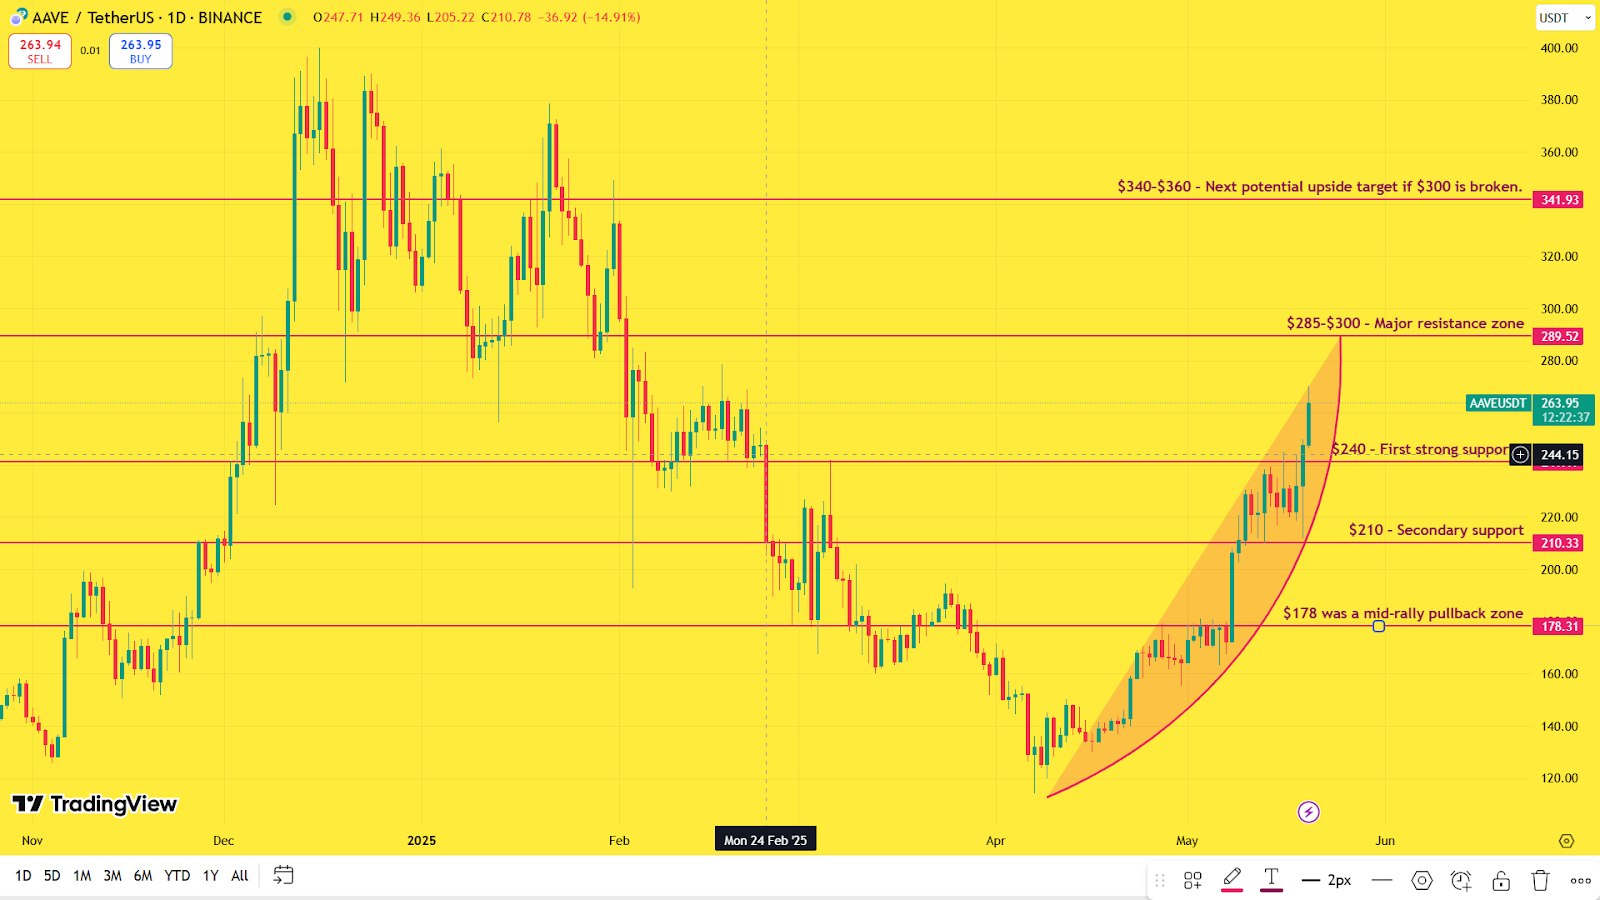
The daily time frame shows that AAVE’s price has risen rapidly since April 9, forming a parabolic curve that has pushed the token from $121.75 to over $265 — marking a 118% increase in just six weeks.
This uptrend broke above a descending resistance line and is now testing a critical resistance zone between $285–$300 , which aligns with a prior distribution level from February.
Currently, AAVE is trading at the upper band of its Bollinger channel , indicating that the price is extended. While this suggests strong buying momentum, it also often precedes short-term pullbacks or consolidation.
Momentum indicators show a similar story.
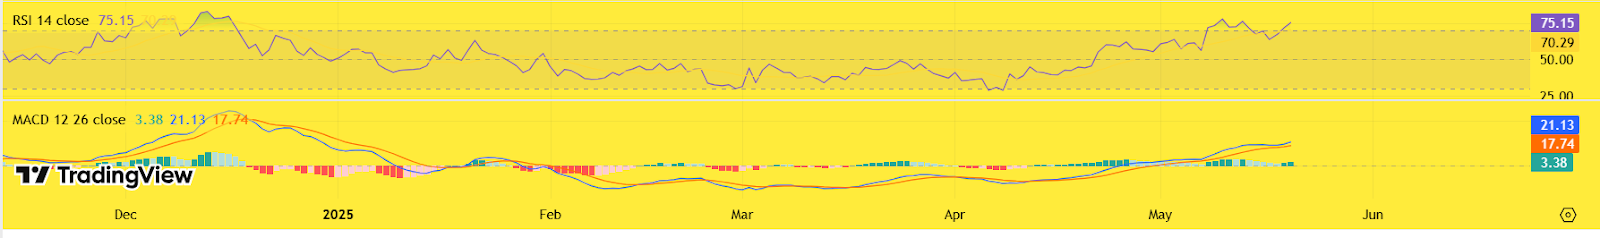
The RSI sits at 74.88 , entering overbought territory for the first time in this rally. This reflects buyer strength but also signals that upside may be limited unless supported by volume.
The MACD remains in a bullish crossover, but the histogram bars are narrowing — a sign that while momentum remains positive, it is weakening.
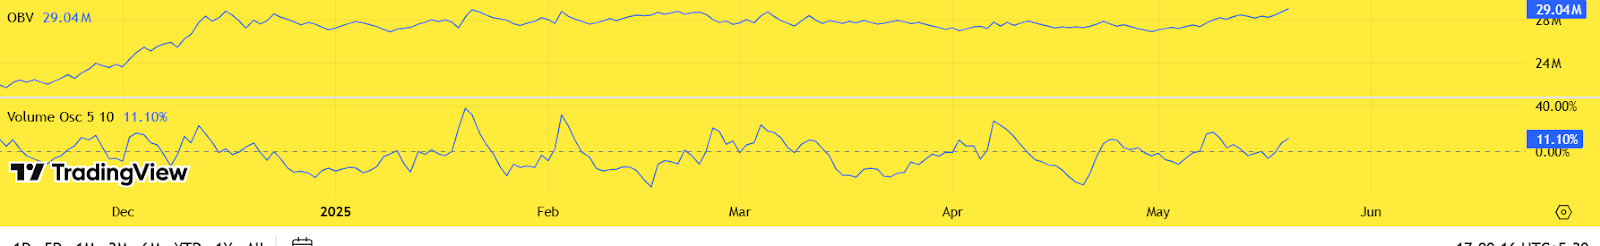
The OBV (On-Balance Volume) — which tracks volume flow relative to price movement — has flattened at 29.04M on the chart after rising steadily through April. This visual plateau signals that buying pressure has stalled , even though the price continues rising.
It often suggests that the rally is losing depth, as fewer buyers are backing the current push.
Meanwhile, the Volume Oscillator , which compares short- and long-term volume averages, is visible at +10.74% — still in positive territory but clearly down from its peak earlier in May .
This decline on the chart indicates a waning pace of new inflows, meaning the bullish impulse is still alive but not accelerating.
Together, these indicators reflect a market that may be nearing a pause or pullback , especially if no fresh volume enters to push AAVE cleanly above its current resistance zone
If AAVE breaks and closes above $300 with strong confirmation, the next target lies at $340–$360 . However, if the rally stalls, support lies at $240 , followed by $210 , near the 20-day EMA and midline of the Bollinger Band.
As of now, the daily structure remains bullish, but momentum indicators suggest caution as price nears exhaustion levels. Traders should monitor $285–$300 closely for either breakout continuation or reversal signals.
AAVE On-Chain Metrics: Holder Confidence Still Strong
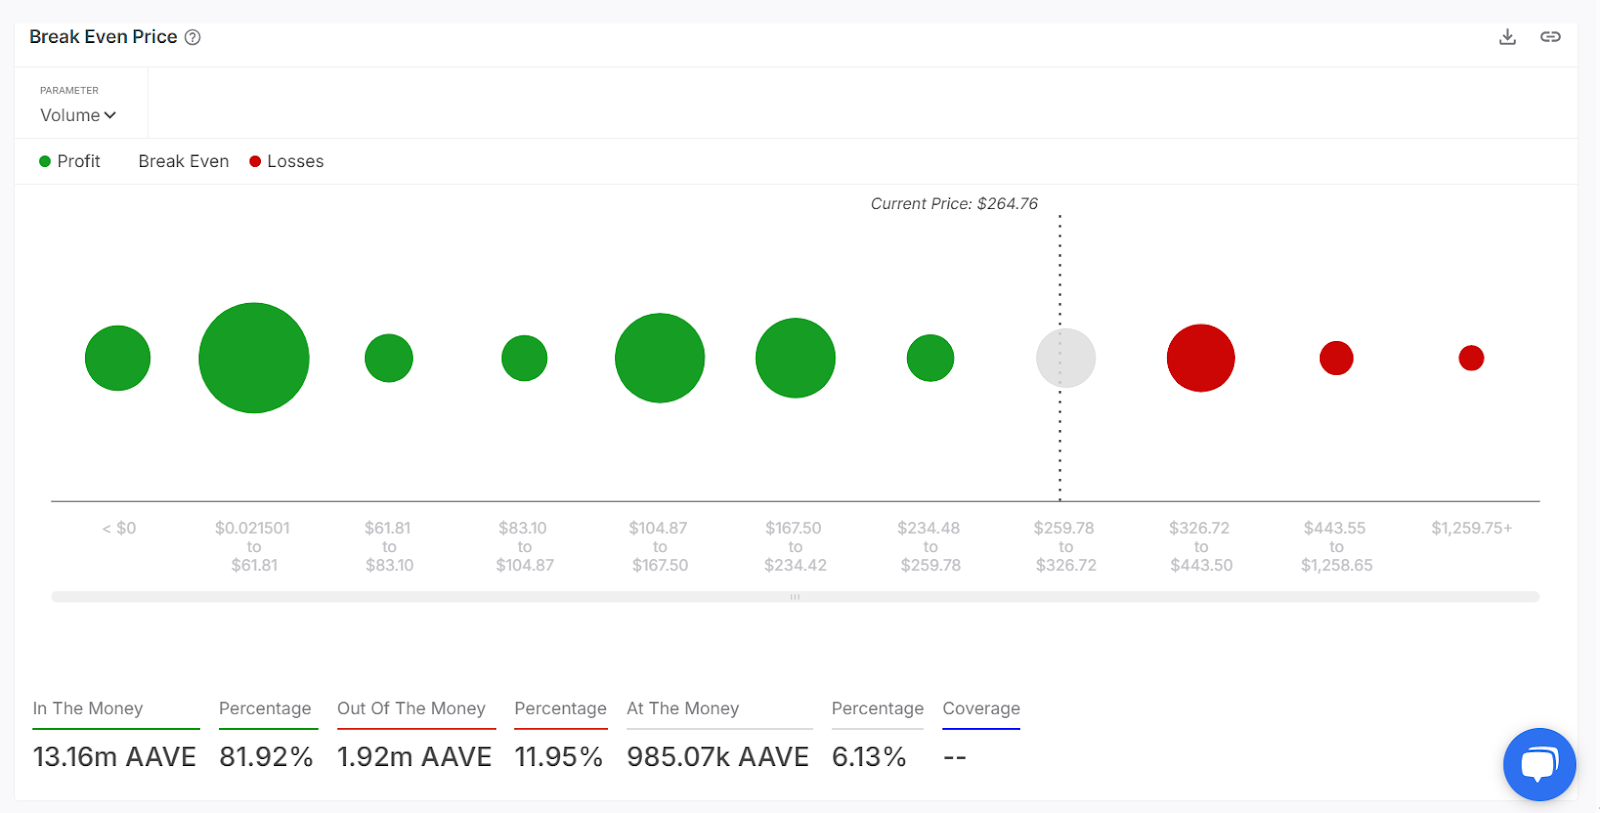
- 81.92% of AAVE tokens are currently “in the money” based on volume-weighted break-even data.
- Only 11.95% of tokens are in loss, reducing potential for aggressive sell-offs.
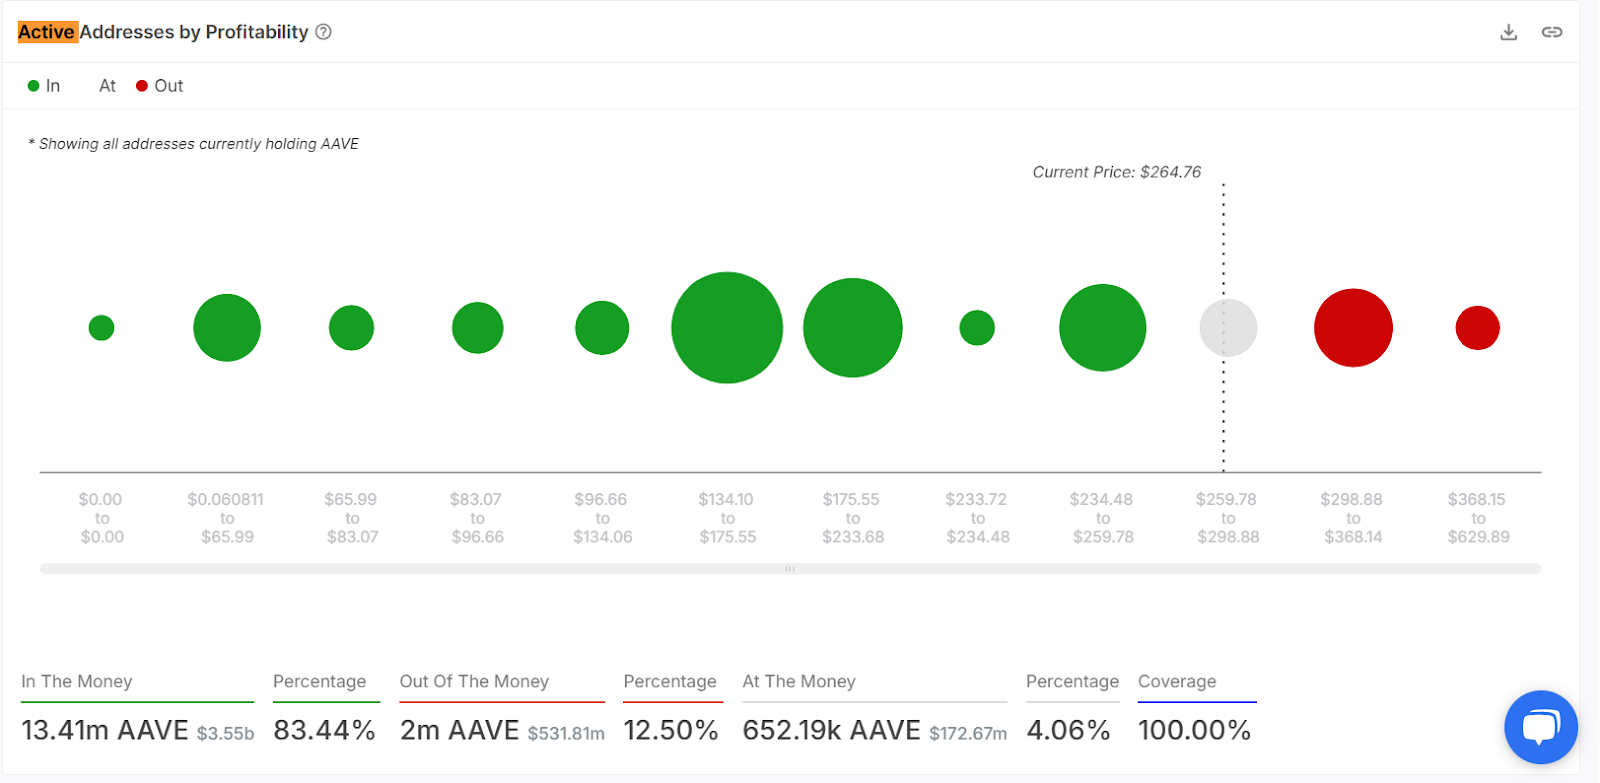
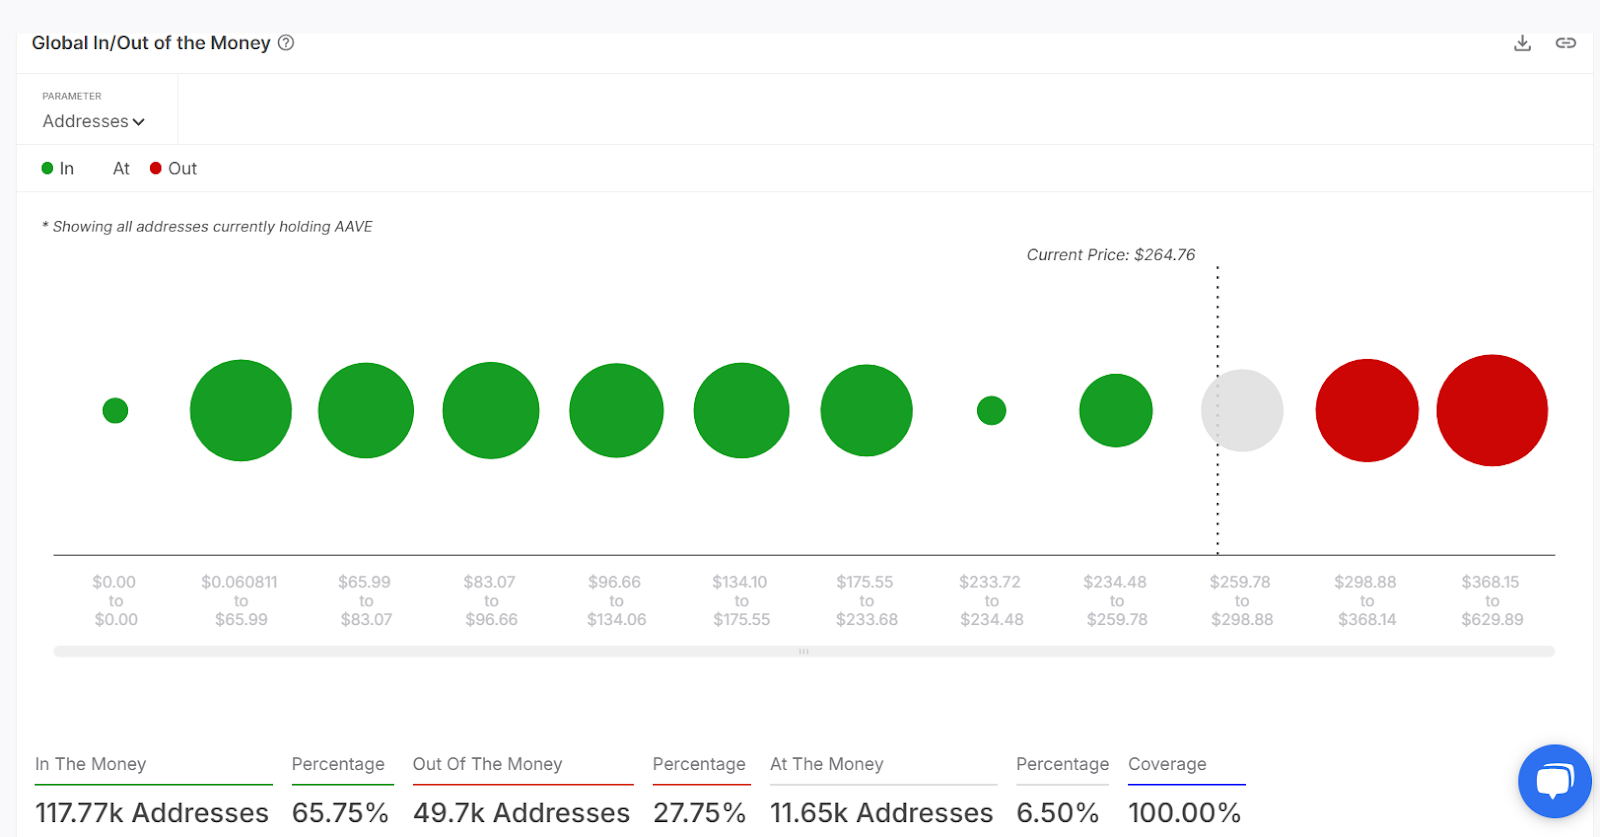
- The “Active Addresses by Profitability” chart shows that 13.41M AAVE worth $3.55B is held by profitable wallets.
- 83.44% of active users are in profit, showing that traders who are using the protocol or actively trading aren’t under pressure to exit.
These figures indicate that most holders are sitting on gains and not rushing to exit — supporting the idea that pullbacks could be shallow unless market sentiment changes dramatically.
AAVE Momentum Strong, But All Eyes on $300 Resistance
AAVE’s six-week rally remains intact, backed by a strong technical uptrend and healthy on-chain support. That said, the current rally is losing some volume momentum, and the $285–$300 zone remains the line in the sand for bulls.
If this level is broken with strong confirmation, the path to $340–$360 opens. Otherwise, a short-term pullback to $240 support is likely before any continuation. Bias remains bullish , but volume and buyer strength above $300 will decide the next phase.

Bitcoin Surges Past $105K as Investors Flock to Meme Coins , Is Pepeto the Next 100 x Crypto?
The post Bitcoin Surges Past $105K as Investors Flock to Meme Coins , Is Pepeto the Next 100 x Crypt...

Missed Bitcoin at $1? Trump Bitcoin Comments Highlight Bitcoin Solaris as Similar Opportunity
The post Missed Bitcoin at $1? Trump Bitcoin Comments Highlight Bitcoin Solaris as Similar Opportuni...

Cardano Price Analysis: ADA Breakout to $1 Imminent?
The post Cardano Price Analysis: ADA Breakout to $1 Imminent? appeared first on Coinpedia Fintech Ne...