XRP Trades Sideways as Moving Averages and Indicators Signal Market Pause


- XRP shows consolidation signs with fading momentum despite holding above $2.39.
- MACD and RSI indicate weakening bullish strength and potential short-term pullback.
- Trading volume drops 25% as price climbs, signaling reduced market participation.
XRP’s recent price action shows a possible consolidation phase, following a strong uptrend supported by multiple moving averages and momentum indicators. On May 18, the asset traded at approximately $2.39, recovering from an intraday drop the previous day. Although the broader structure still leans bullish, technical indicators and trading volume show signs of slowing momentum, indicating that XRP may face difficulty advancing unless new drivers emerge.
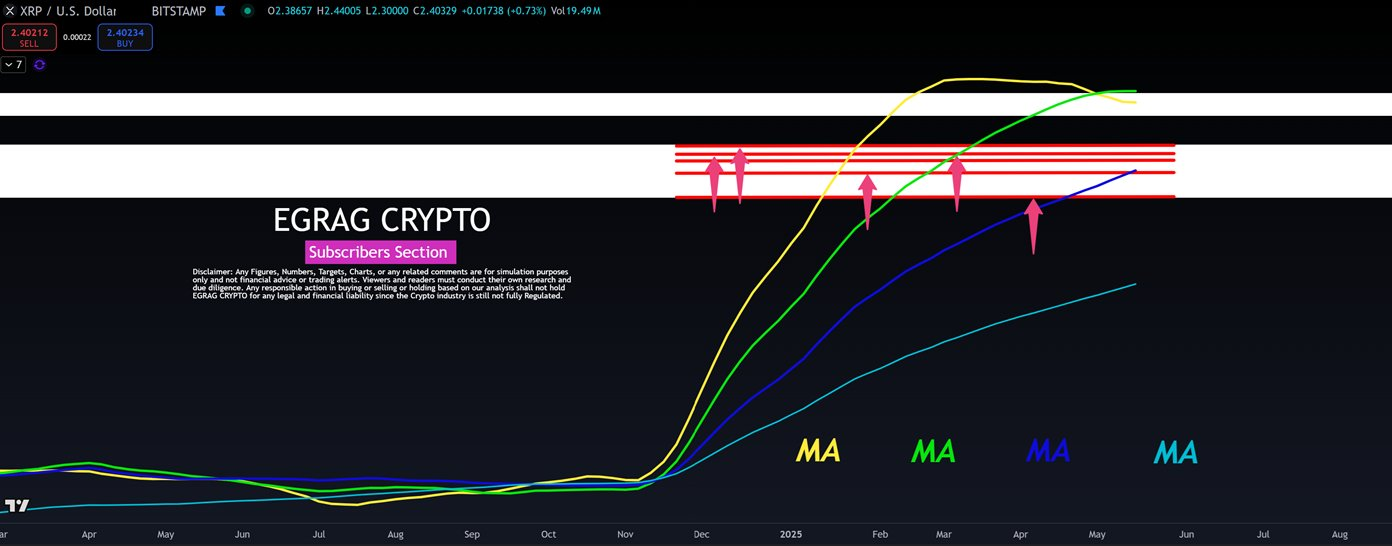
A chart released by analyst EGRAG CRYPTO shows four key moving averages, colored yellow, green, dark blue, and light blue, that have supported XRP ’s uptrend since late 2024. These averages, representing both short- and long-term trends, show a consistent upward parallel alignment, often associated with sustained bullish sentiment.
The yellow and green lines, likely reflecting shorter-term averages, lead the upward curve. However, both appear to be flattening as they approach multiple red horizontal resistance lines at the top of the chart.

These levels, marked with upward arrows, point to key zones where previous rallies have met selling pressure. This formation suggests a potential pause or consolidation in price unless XRP gathers the strength to break through these resistance points.
Momentum Indicators Show Cooling Buying Pressure
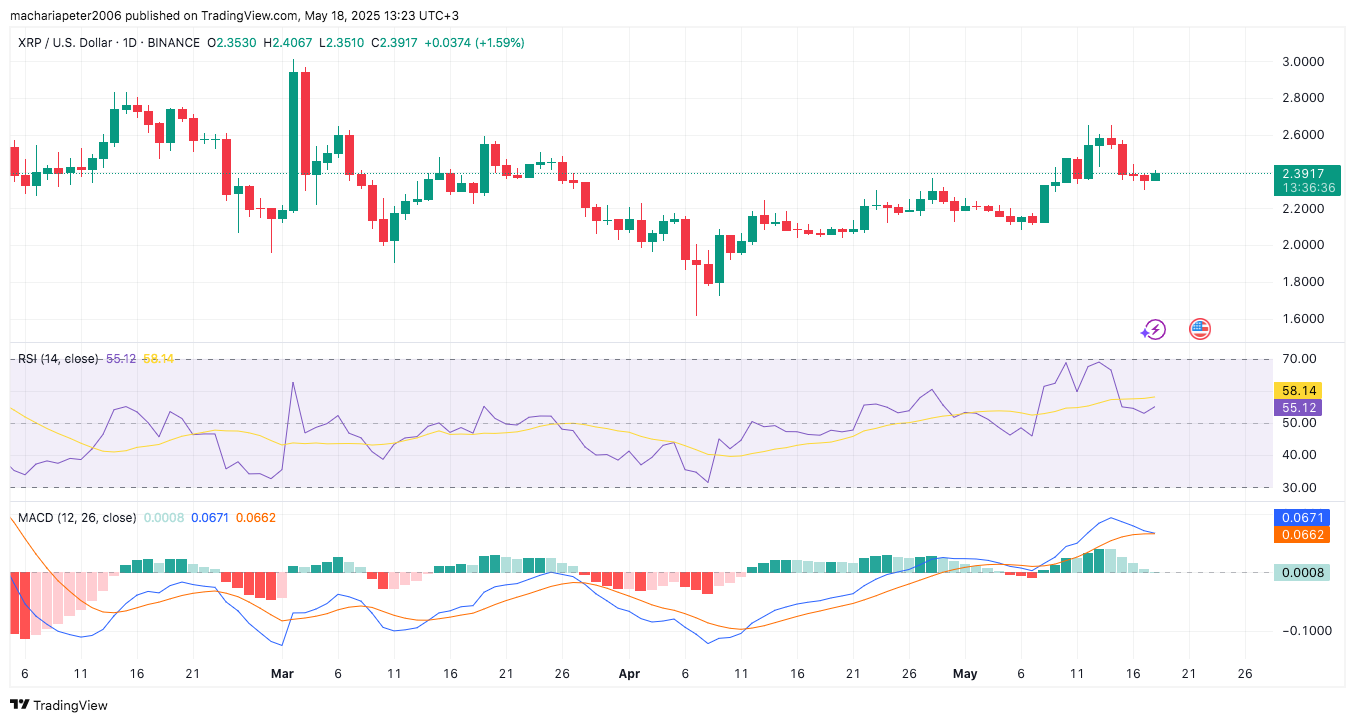
Daily momentum indicators offer additional context. The Moving Average Convergence Divergence (MACD) line stands at 0.0671, just above the signal line at 0.0662. The histogram reading is positive at 0.0008 but shows declining bar height, signaling weakening upward momentum.

At the same time, the Relative Strength Index (RSI) has decreased to 55.12, falling below its 14-day moving average of 58.14. While this figure remains in neutral territory, it represents a drop from near-overbought levels seen earlier in May. Continued declines in RSI below 50 may reflect a broader weakening in market sentiment and could prompt further short-term corrections.
The MACD and RSI suggest that bullish momentum is present but fading. These conditions typically precede sideways trading or a slight pullback unless external catalysts inject new energy into the market, such as regulatory decisions or product launches.
Trading Volume Falls as XRP Holds Gains
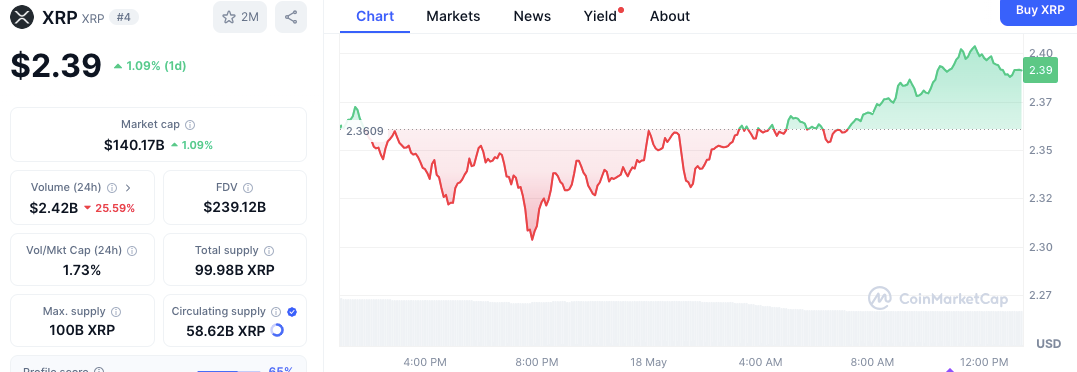
Despite prices heading up, there have been fewer trades. In the past 24 hours, the volume of XRP was 25.59% lower, reaching $2.42 billion. Still, the token appreciated 1.59%, but there were fewer people taking part in shaping the market movement.

The market cap of this cryptocurrency is currently $140.17 billion, placing it fourth in the market. At present, the circulating supply of XRP is 58.62 billion and the maximum supply is 100 billion. After taking into account the supply structure, the FDV of Pfizer shares has reached around $239.12 billion.

Ethereum Faces Potential Pullback as Technical Signal Emerges
TD Sequential signals trend exhaustion near $2,500 as $ETH stalls after rally; resistance seen at $2...

Top 7 EVM-Compatible Chains by 7D Active Addresses: Base, BNB Chain, Ethereum & Others
The data showed a fresh list of top EVM-compatible chains, including Base, BNB Chain, Ethereum, 0xPo...

Top Analysts Bet on Web3 ai and Its $1 Potential – Not on Avalanche Breakout News or Stellar’s RWA Plans
Stellar (XLM) eyes $0.88 with $3B in real-world assets, Avalanche (AVAX) gains from a 680% user spik...


 :
:


 …
…