Bitcoin Price Breakout Brewing: Is a Massive Rally Just Getting Started?


Bitcoin price started a fresh surge above the $102,000 zone. BTC is rising and might aim for a move toward the $107,500 resistance.
- Bitcoin started a strong increase above the $100,500 resistance zone.
- The price is trading above $102,500 and the 100 hourly Simple moving average.
- There is a new connecting bullish trend line forming with support at $103,500 on the hourly chart of the BTC/USD pair (data feed from Kraken).
- The pair could start another increase if it clears the $105,000 zone.
Bitcoin Price Aims More Gains
Bitcoin price started a fresh increase from the $96,500 support zone. BTC formed a base and was able to clear the $98,800 resistance zone. The bulls even pushed the price above $102,000.
The pair spiked above $104,500 and tested $105,000. A high is formed at $104,943 and the price is now consolidating gains above the 23.6% Fib retracement level of the upward move from the $95,825 swing low to the $104,943 high.
Bitcoin is now trading above $103,500 and the 100 hourly Simple moving average . There is also a new connecting bullish trend line forming with support at $103,500 on the hourly chart of the BTC/USD pair.
On the upside, immediate resistance is near the $104,500 level. The first key resistance is near the $105,000 level. The next key resistance could be $105,500. A close above the $105,500 resistance might send the price further higher. In the stated case, the price could rise and test the $106,200 resistance level. Any more gains might send the price toward the $108,000 level.
Are Dips Supported In BTC?
If Bitcoin fails to rise above the $104,500 resistance zone, it could start another downside correction. Immediate support on the downside is near the $103,500 level and the trend line. The first major support is near the $102,800 level.
The next support is now near the $100,500 zone and the 50% Fib retracement level of the upward move from the $95,825 swing low to the $104,943 high. Any more losses might send the price toward the $98,800 support in the near term. The main support sits at $97,500.
Technical indicators:
Hourly MACD – The MACD is now gaining pace in the bullish zone.
Hourly RSI (Relative Strength Index) – The RSI for BTC/USD is now above the 50 level.
Major Support Levels – $103,500, followed by $102,800.
Major Resistance Levels – $104,500 and $105,000.
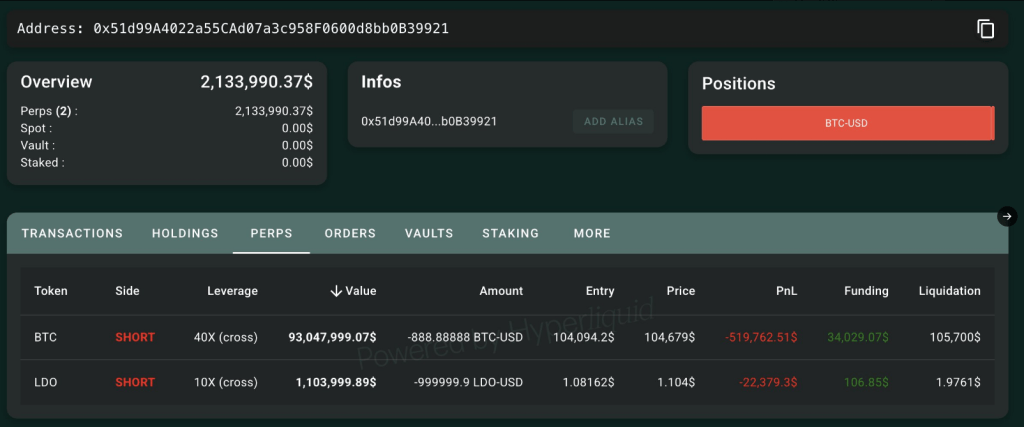
Bitcoin’s $104,000 Peak Sparks High-Stakes Short Positions – Details
Bitcoin continued its climb past $104,000 on Monday, and that rally has tempted some big traders to ...
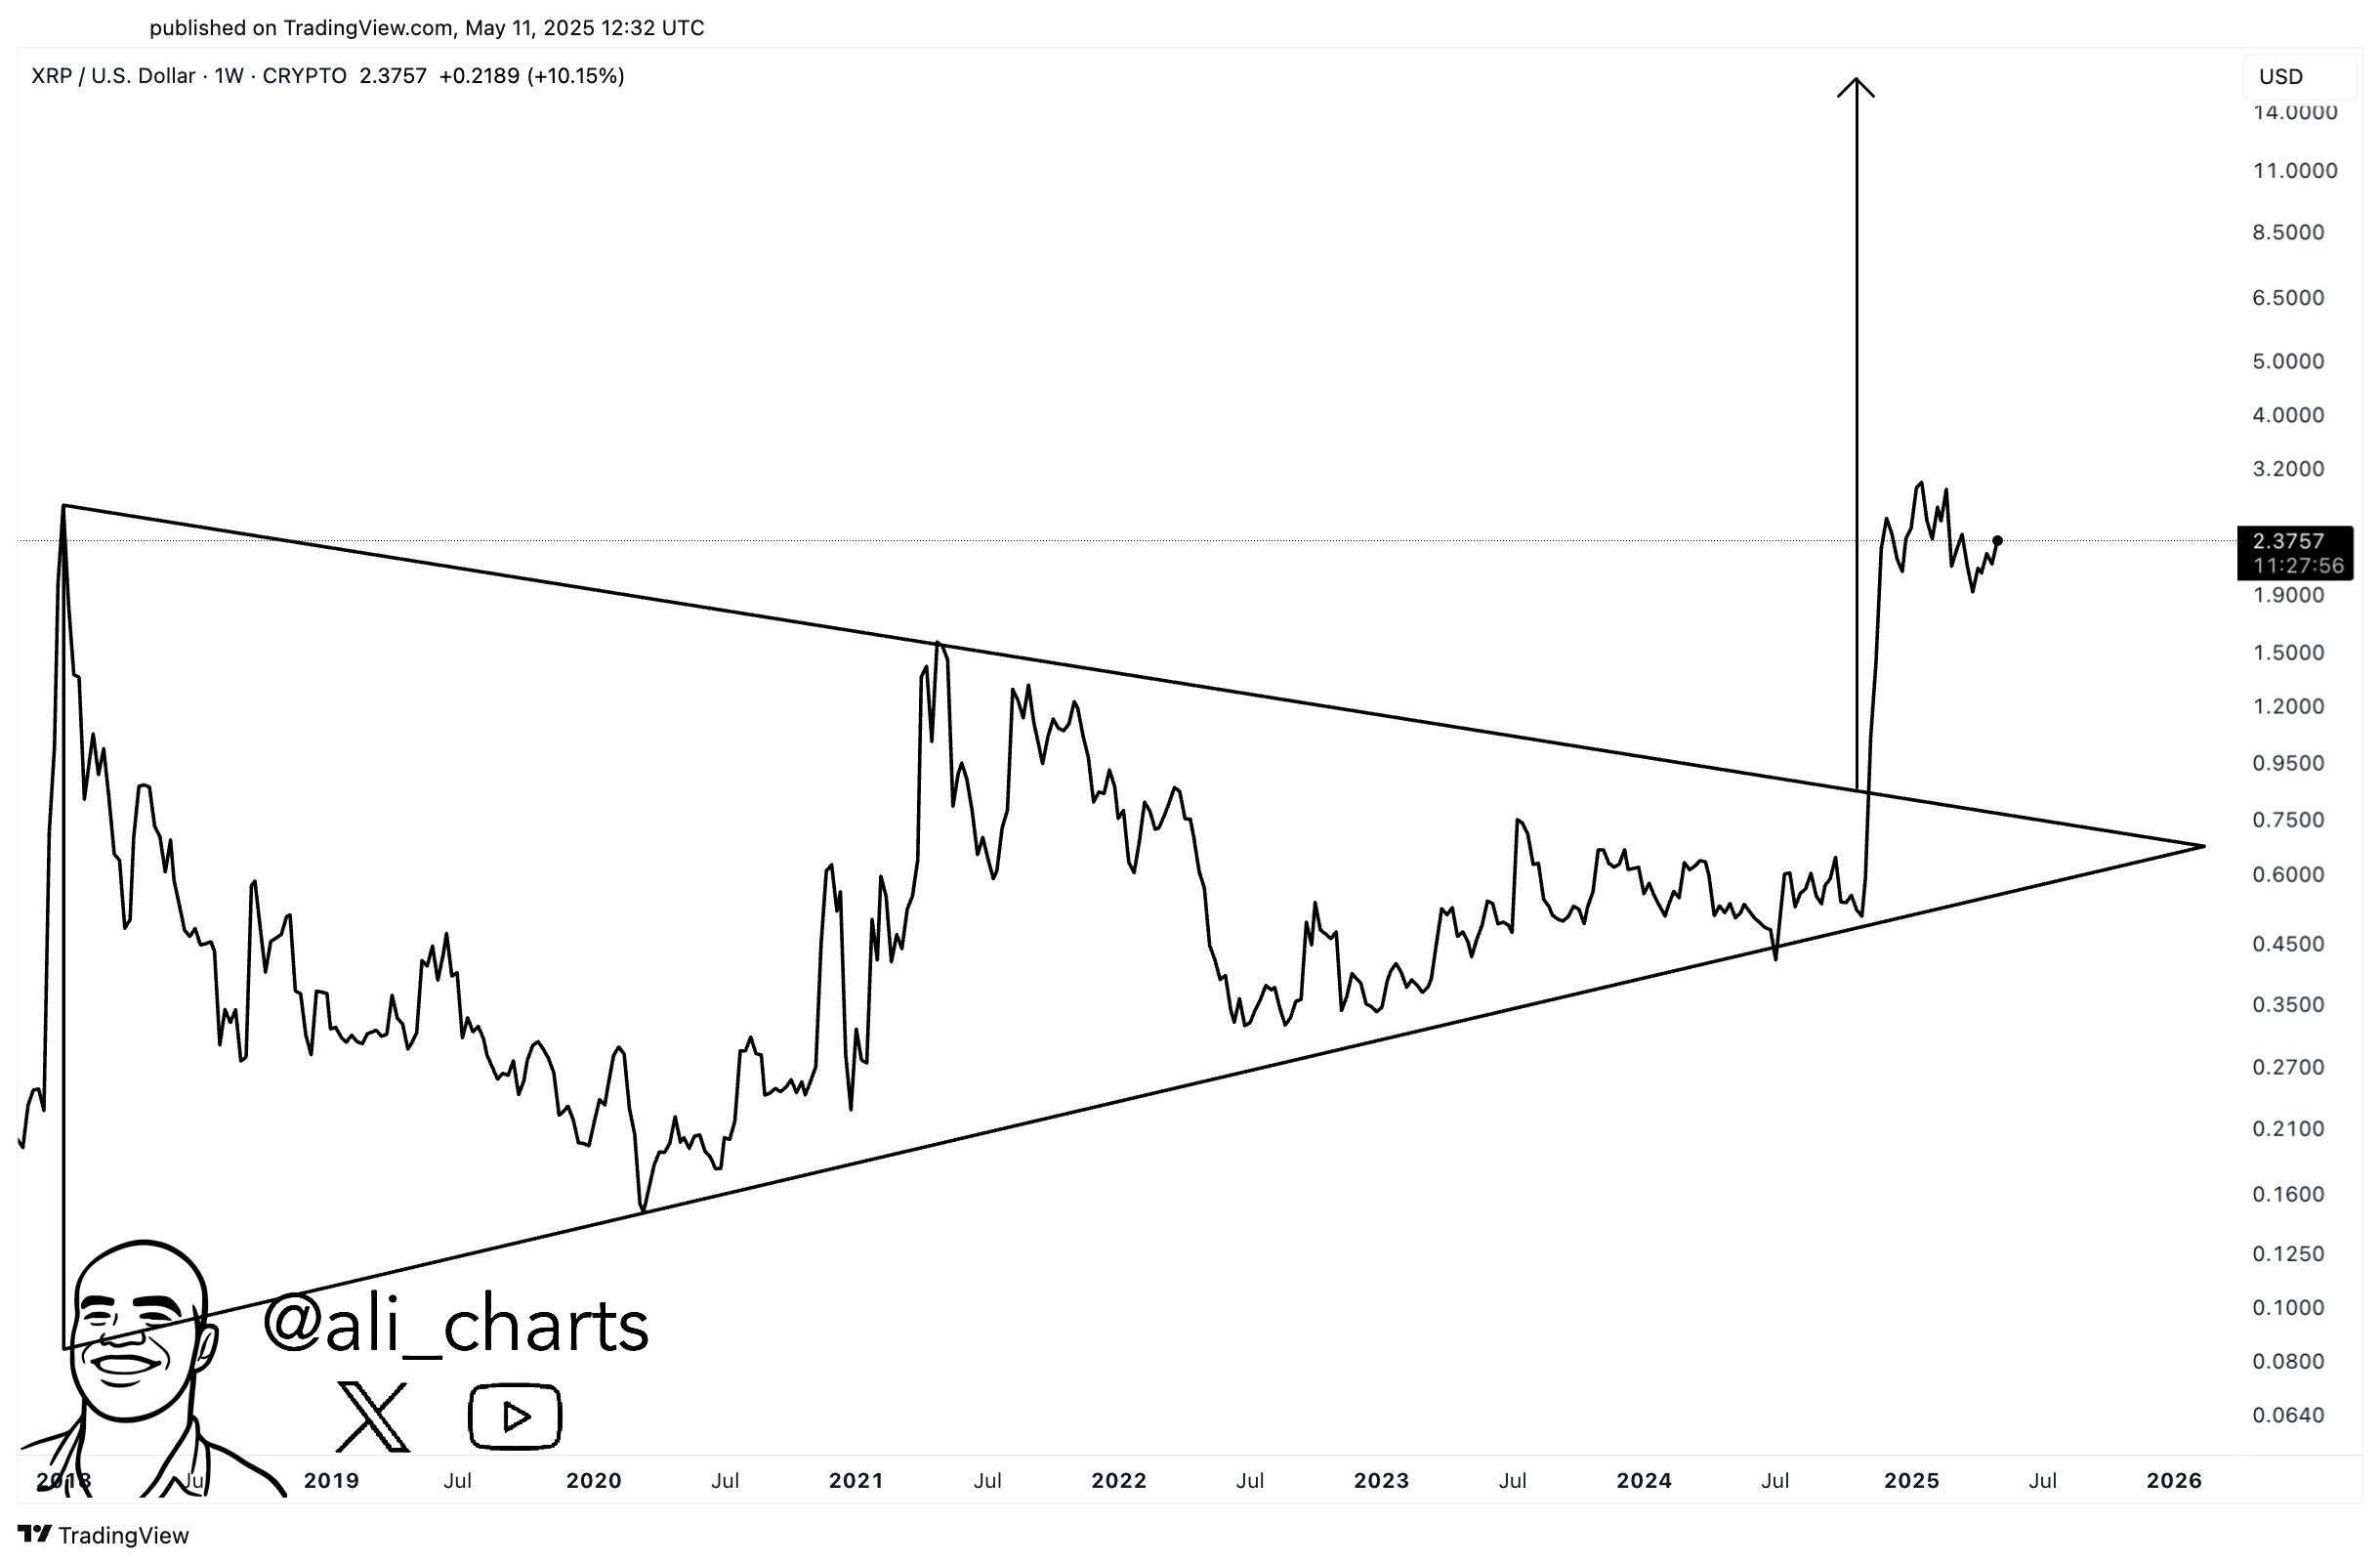
XRP Target Could Be $15 If This Pattern Is In Play, Analyst Says
An analyst has explained how XRP could end up targeting the $15 mark if this pattern is the governin...

PEPE Becomes Most Traded Meme Coin, Outsmarting DOGE With $4-B Volume
PEPE token is hogging the headlines, and for the right reasons. The meme coin, defying the odds, has...