Bitcoin Derivatives In The Driver’s Seat For $100,000 Rally, Data Shows


Data shows the Bitcoin derivatives trading volume has been higher than the spot one during BTC’s latest recovery rally beyond $100,000.
Bitcoin Trading Volume Ratio Has Declined Under The 1.0 Mark Recently
In a new post on X, CryptoQuant author Axel Adler Jr has talked about the trend in the Trading Volume Ratio for Bitcoin. The “Trading Volume Ratio” is an indicator that keeps track of the ratio between the amount of the asset becoming involved in trading on spot exchanges and that on derivatives ones.
When the value of this metric is greater than 1, it means the spot platforms are witnessing a higher amount of trading volume than the derivatives ones. On the other hand, it being under the threshold suggests the dominance of derivatives trading activity among the investors.
Now, here is the chart shared by the analyst that shows the trend in the Bitcoin Trading Volume Ratio over the last couple of years:
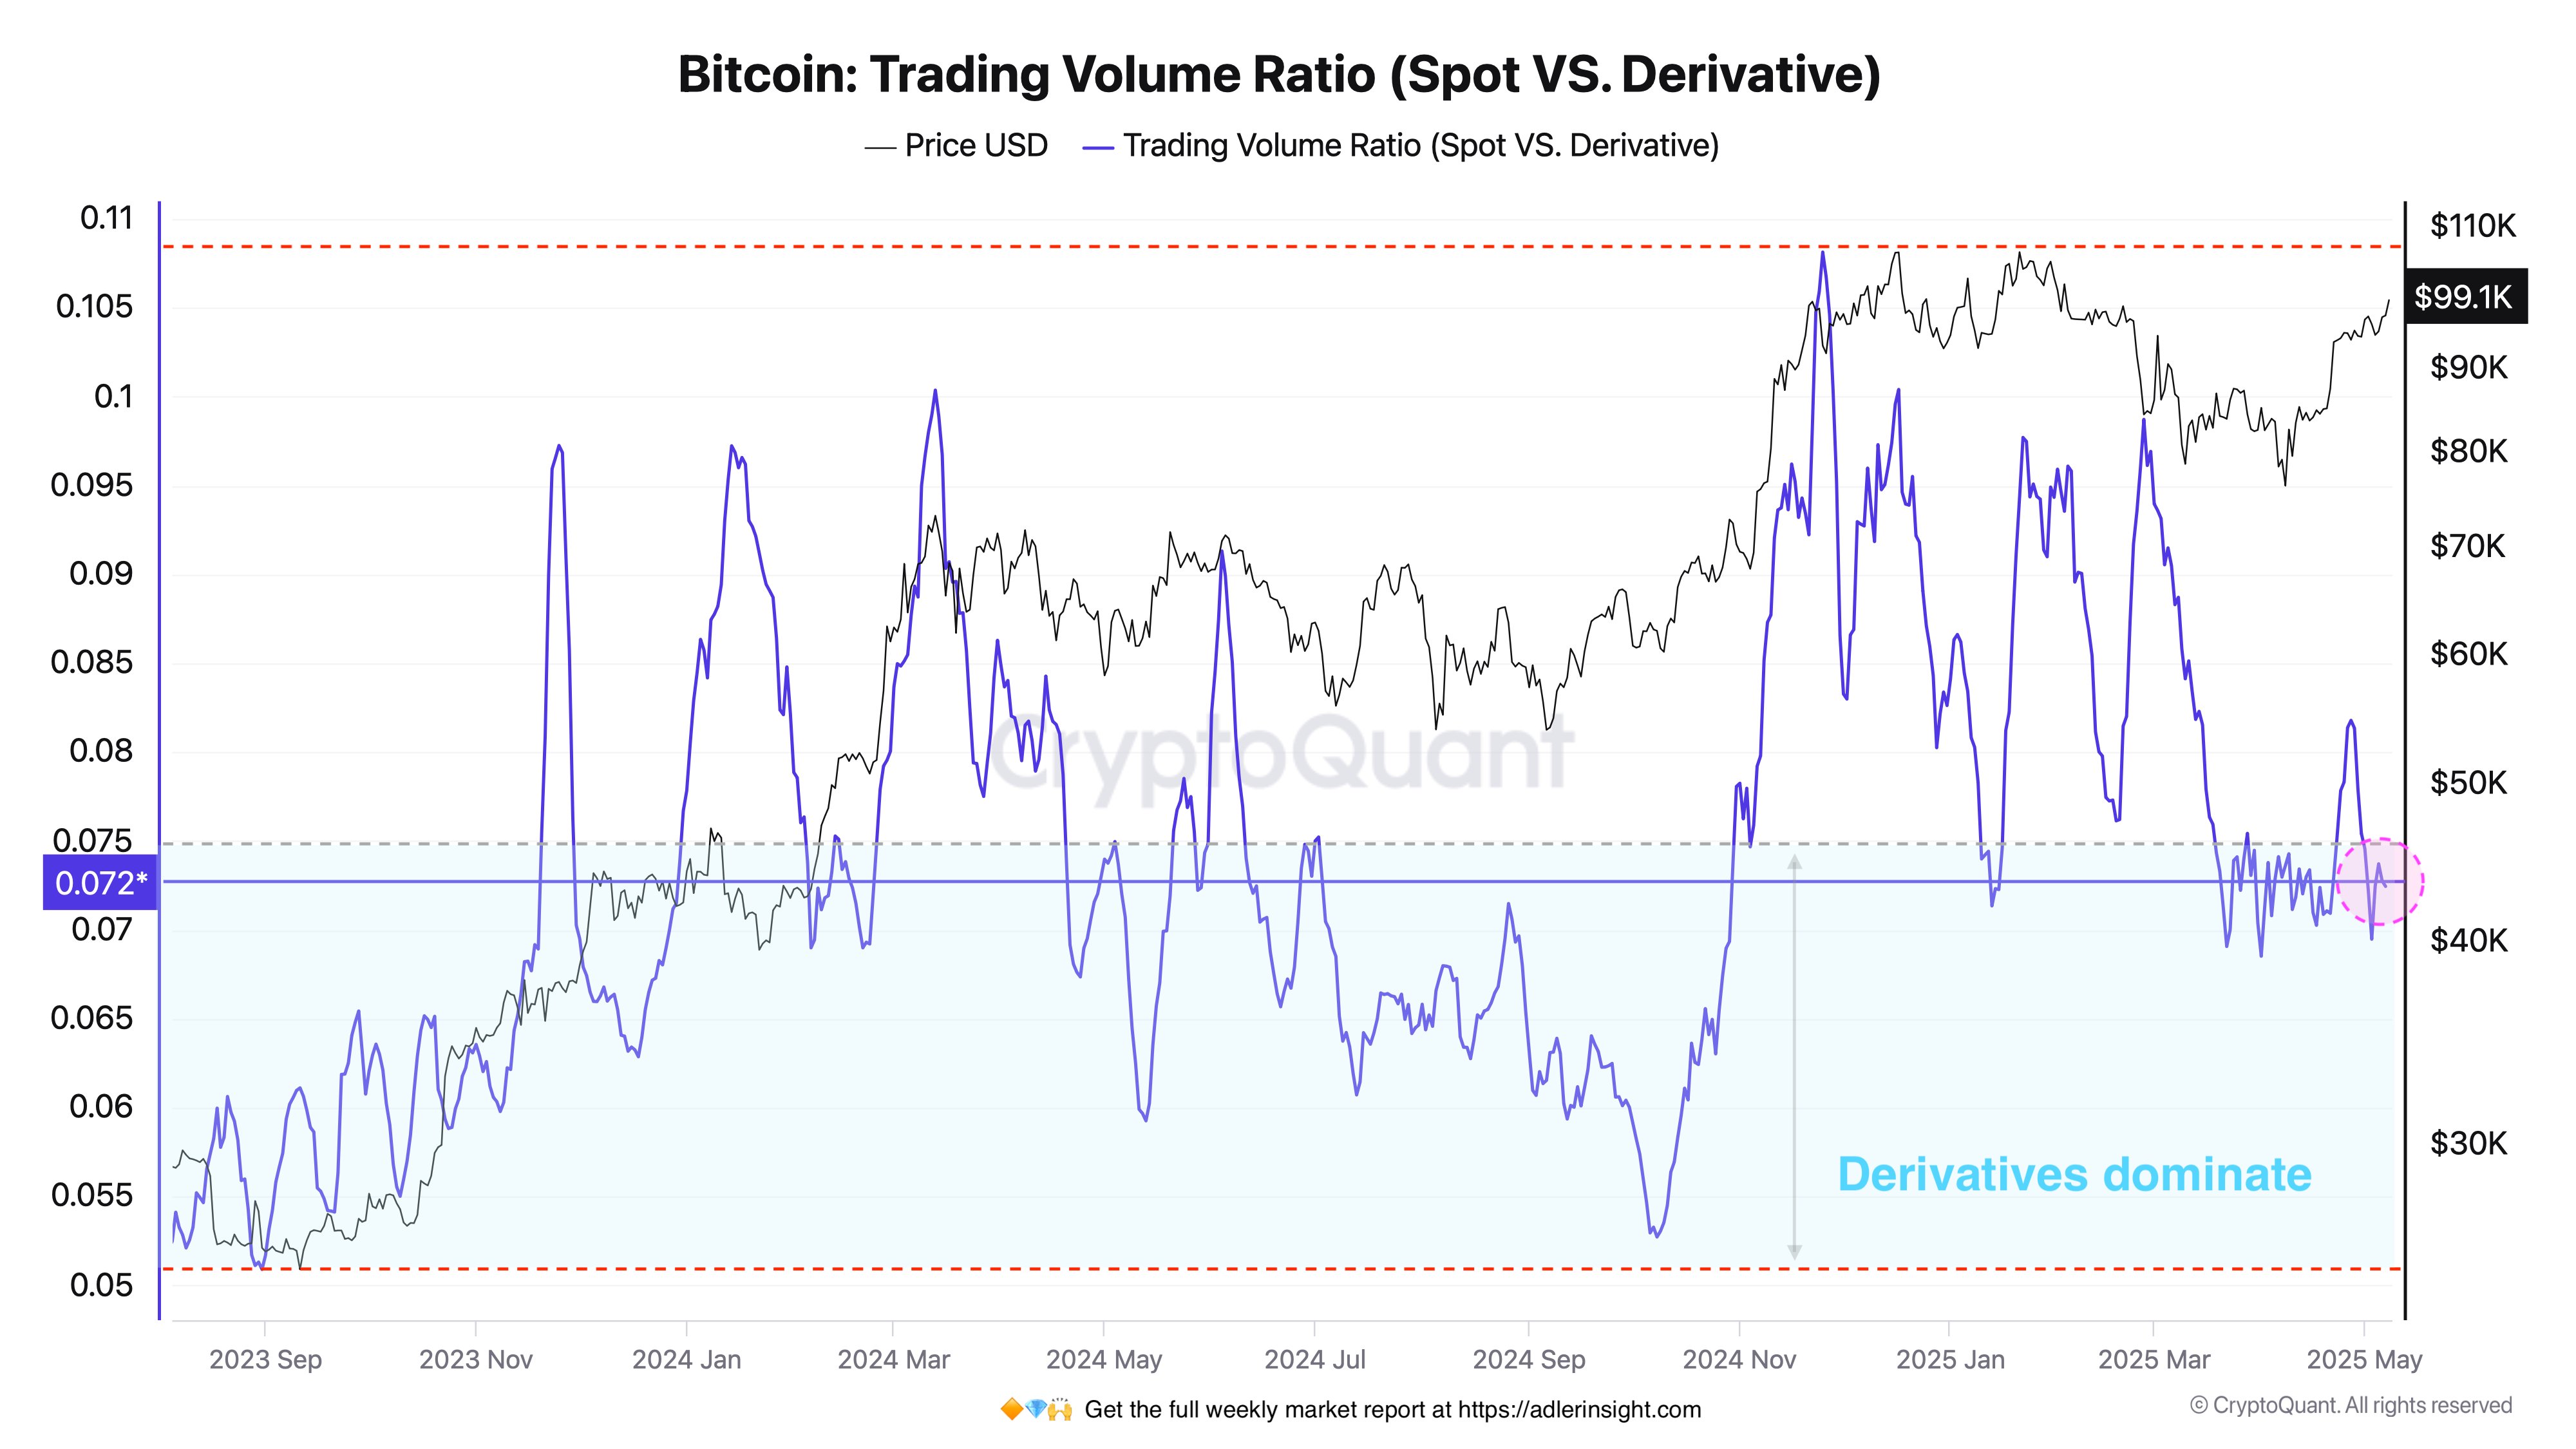
As displayed in the above graph, the Bitcoin Trading Volume Ratio has been sitting under the 1 mark recently, suggesting volume on the derivatives platforms has been outpacing that on the spot ones.
This has maintained while the cryptocurrency has gone through its latest leg of the recovery rally , which has taken its price back above the $100,000 level. From the chart, it’s visible that the trend was different during last month’s rally.
This previous leg of the run was accompanied by a spike in the Trading Volume Ratio above the 1 level, an indication that spot trades were potentially the main fuel behind it.
Historically, sustainable price rallies have generally been of this kind; runs that are borne out of high speculative activity on the derivatives market tend to be unstable.
Given that the derivatives market has dominated in this rally so far, it’s possible that it could have trouble lasting. Though, it only remains to be seen how things would develop for Bitcoin.
In some other news, Ethereum is extremely undervalued compared to Bitcoin, as the on-chain analytics firm CryptoQuant has revealed in an X post .
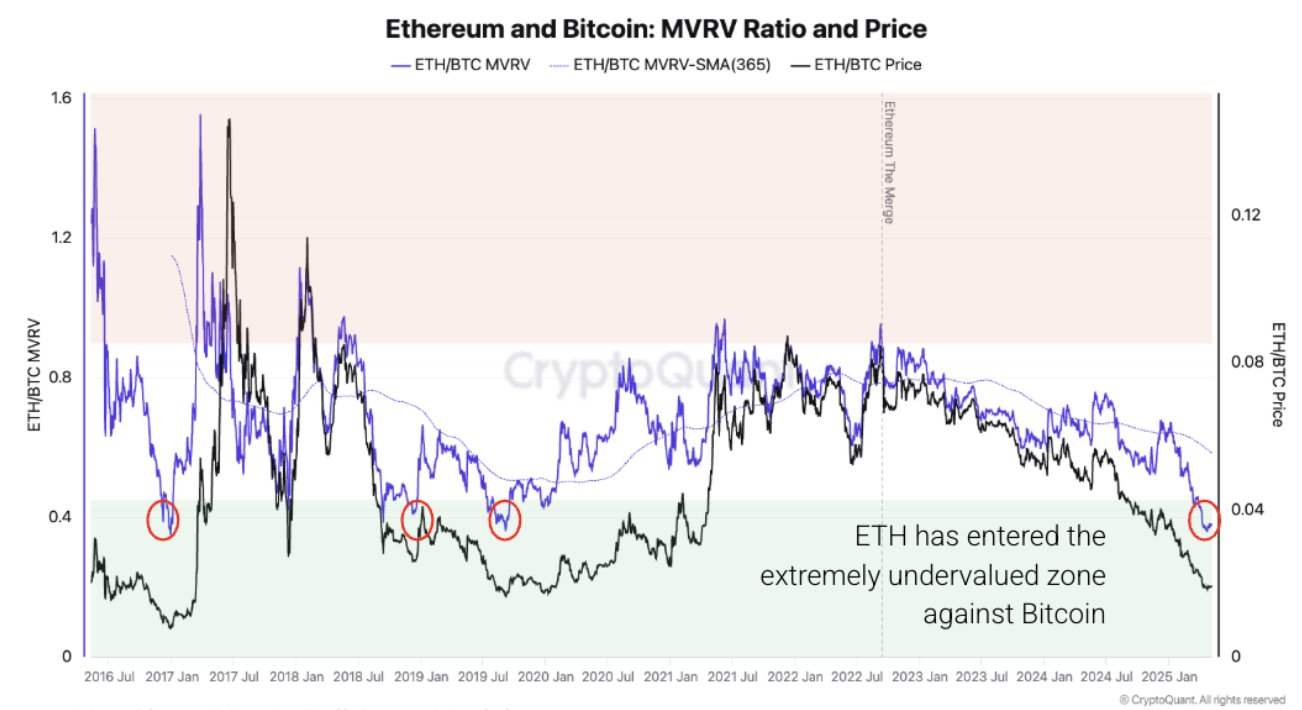
The indicator shared by the analytics firm is the ratio between the Ethereum and Bitcoin Market Value to Realized Value (MVRV) Ratios. The MVRV Ratio is a popular on-chain metric that basically keeps track of the profit-loss situation of the investors as a whole.
As is visible in the chart, the MVRV Ratio of ETH is very low compared to the one for BTC right now. “Historically, this led to Ethereum outperforming,” notes CryptoQuant. “However, supply pressure, weak demand, and flat activity could stall a rebound.”
BTC Price
Following a surge of nearly 3% in the last 24 hours, Bitcoin has managed to break above the $101,000 level.

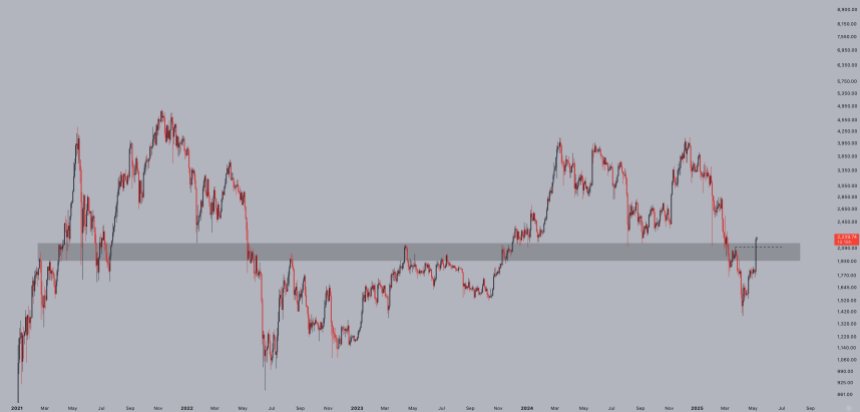
Ethereum Breaks Key Resistance In One Massive Move – Higher High Confirms Momentum
Ethereum has finally broken above the long-watched $2,000 resistance level—and it didn’t just edge p...
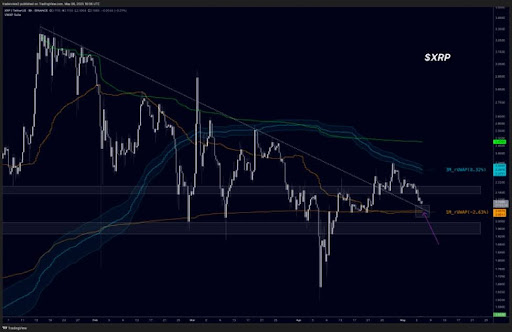
Crypto Analyst Says XRP Price Must Clear This Level Or Risk Crash To $1.9
The XRP price is at a make-or-break moment as it struggles to hold a critical technical level as it ...

Rumble to Launch Tether-Collab Crypto Wallet in Q3 2025. Here’s Why the Best Wallet Token Could Explode
Chris Pavlovski, Rumble’s founder and CEO, took to X to announce the launch of a Bitcoin and stablec...