Shiba Inu Could Erupt 500%—Analyst Sounds The Alarm


Shiba Inu (SHIB) might have its price increase more than fivefold from where it is now, based on recent market analysis. The meme coin trades at $0.0000125, down 3% from its daily high and 9% within the last seven days. In spite of these latest plunges, an analyst is optimistic about SHIB’s prospects.
Price Target Suggests Whopping Gains Ahead
Technical analyst Javon Marks reaffirms his earlier projection that Shiba Inu will most probably reach $0.000081 during the current cycle in the market. This goal is up 500% from the current price. Marks mentions SHIB’s bull run to $0.000033 in December 2024. Then, the price drops back to $0.000010, which according to the analyst, is “expected” and part of a healthy correction process.
The token settled above $0.00002 as of the close in 2024, something Marks considers as validation of his technical perspective. Present price levels at $0.00001290 now are what he terms a base for the anticipated higher move.
We maintain our $0.000081 breakout target for $SHIB (Shiba Inu), projecting a nearly +500% uphill run to reach it… https://t.co/8OdILFYB5q pic.twitter.com/jTxSAGqiWA
— JAVON
MARKS (@JavonTM1) May 3, 2025
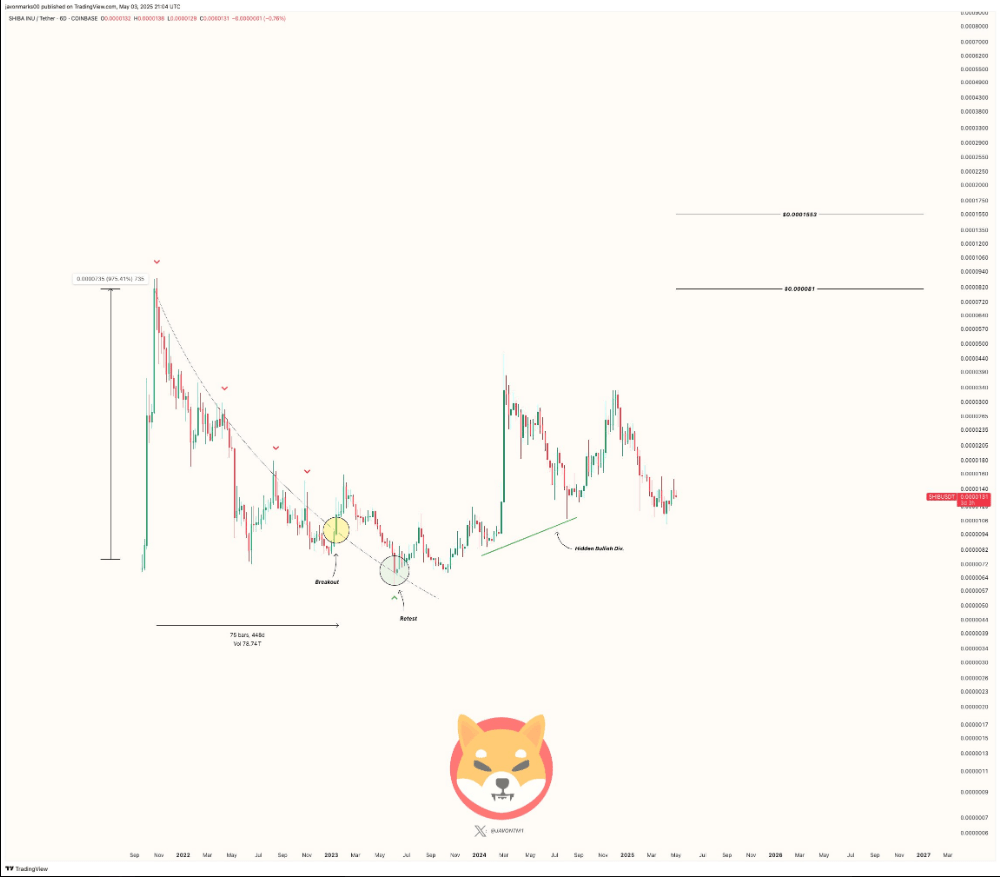
Technical Indications Suggest Hidden Bullish Divergence
As per market reports, the chart of SHIB shows a trend called hidden bullish divergence . This occurs when prices create higher lows but technical indicators such as RSI (Relative Strength Index) or MACD (Moving Average Convergence Divergence) give lower lows.

Marks infers this pattern is indicative of increasing buying pressure hidden beneath, contrary to apparent weakness in near-term momentum measures. The token remains above such key levels of support while also establishing higher price lows, adding to its technical strength. Buyers and sellers wait for a break from the sideways pattern of recent trading, something that may force prices upward when volume increases.
Long-Term Holders Keep GrowingMeanwhile, latest data indicates growth in SHIB investors with over one year holding the same. The segment has consistently increased since mid-2022 and continued to grow through early 2025. Long-term holders grew during both price appreciation and depreciation, indicating steady accumulation during any market condition.
An expanded foundation of long-term holders normally tames selling pressures, assisting with price support as well as other important support areas. The size of short-term traders (lesser than a month’s holders) declined by 35%. Holders with intermediate terms have risen by 3%. This change demonstrates deceleration towards short investment programs.
Featured image from Unsplash, chart from TradingView
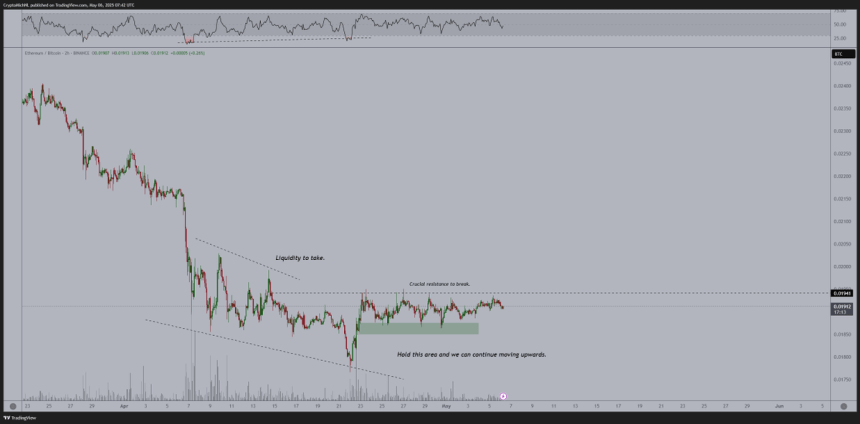
Ethereum Consolidates As Accumulation Trend Develops – New Bullish Phase Ahead?
Ethereum is under pressure after failing to break above the $1,874 high set on May 1st, a level that...
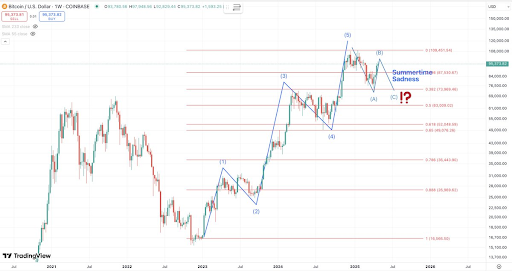
Elliot Wave Theory Shows Where Bitcoin Is In This Cycle – Bull Rally Over?
Crypto analyst Tolimanu has used the Elliott Wave Theory to provide insights into where Bitcoin curr...
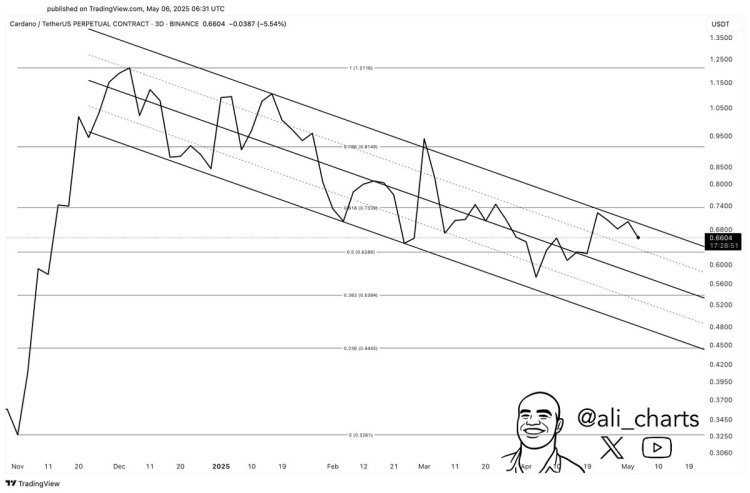
Cardano Struggles At Resistance – Expert Sees A Retest of Lower Support Levels
Cardano (ADA) is trading at a critical juncture after several days of sideways consolidation around ...