Bitcoin Price Flirts With Breakout — Key Resistance In Sight


Bitcoin price is consolidating gains above the $94,000 zone. BTC is showing positive signs and might aim for a move above the $95,500 resistance zone.
- Bitcoin remained supported above the $93,500 zone.
- The price is trading above $94,000 and the 100 hourly Simple moving average.
- There is a connecting bullish trend line forming with support at $94,200 on the hourly chart of the BTC/USD pair (data feed from Kraken).
- The pair could start another increase if it clears the $95,500 zone.
Bitcoin Price Eyes Key Upside Break
Bitcoin price remained stable above the $93,500 level and started a fresh increase . BTC was able to climb above the $94,000 and $94,200 resistance levels.
The bulls were able to pump the price above the $95,200 resistance. The recent high was formed at $95,488 and the price started a downside correction. There was a drop below the $94,500 and $94,200 levels. The price dipped below the 50% Fib retracement level of the upward move from the $92,900 swing low to the $95,488 high.
However, the bulls were active near the $93,500 support and the 76.4% Fib retracement level of the upward move from the $92,900 swing low to the $95,488 high.
Bitcoin price is now trading above $94,200 and the 100 hourly Simple moving average . There is also a connecting bullish trend line forming with support at $94,200 on the hourly chart of the BTC/USD pair.
On the upside, immediate resistance is near the $95,250 level. The first key resistance is near the $95,500 level. The next key resistance could be $96,250. A close above the $96,250 resistance might send the price further higher. In the stated case, the price could rise and test the $97,500 resistance level. Any more gains might send the price toward the $98,800 level.
Another Decline In BTC?
If Bitcoin fails to rise above the $95,500 resistance zone, it could start another downside correction. Immediate support on the downside is near the $94,200 level and the trend line. The first major support is near the $93,500 level.
The next support is now near the $92,900 zone. Any more losses might send the price toward the $92,500 support in the near term. The main support sits at $91,200.
Technical indicators:
Hourly MACD – The MACD is now gaining pace in the bullish zone.
Hourly RSI (Relative Strength Index) – The RSI for BTC/USD is now above the 50 level.
Major Support Levels – $94,200, followed by $93,500.
Major Resistance Levels – $95,250 and $95,500.
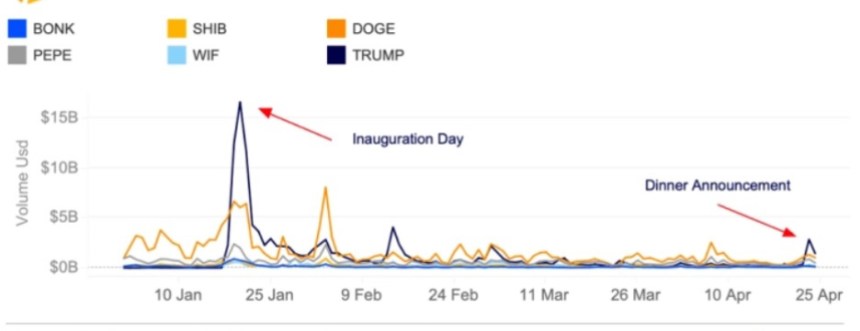
TRUMP’s 80% Surge: How an Exclusive Dinner Triggered a 200% Increase In On-Chain Transactions
An exclusive dinner event has been organized by President Trump for holders of the controversial mem...
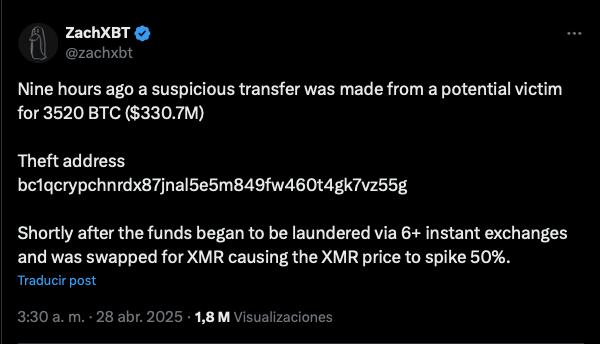
Monero (XMR) Price Jumps 50% Amid ‘Suspicious’ $330 Million BTC Transfer – Details
An analyst has suggested that Monero (XMR) could repeat its 2021 cycle-high amid its recent price ju...
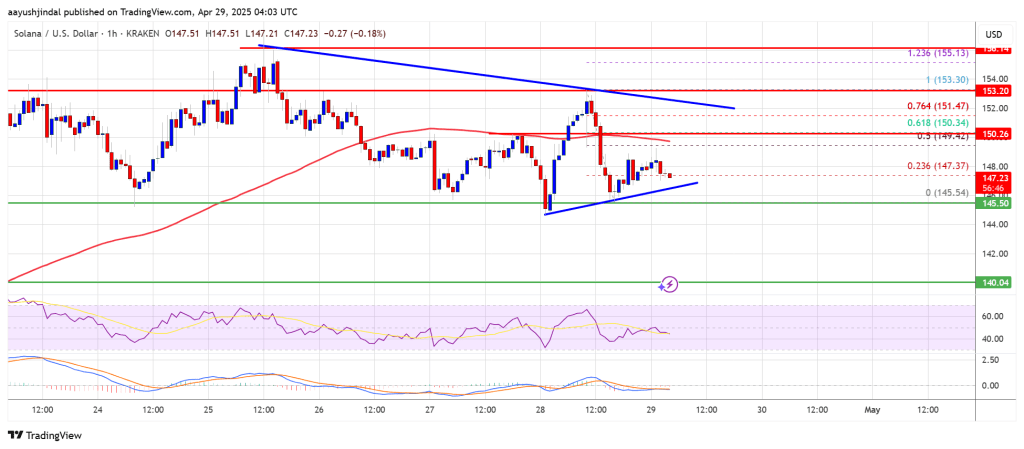
Solana (SOL) Sideways But Bullish — Surge May Be Imminent
Solana started a fresh increase from the $142 support zone. SOL price is now consolidating and might...