Bitcoin Price Sees Short-Term Dip — Bulls Plot Their Next Move


Bitcoin price is correcting gains from the $95,000 zone. BTC is back below $94,000 and might test the $91,200 support zone in the near term.
- Bitcoin started a minor downside correction below the $94,000 zone.
- The price is trading below $94,000 and the 100 hourly Simple moving average.
- There is a connecting bearish trend line forming with resistance at $94,000 on the hourly chart of the BTC/USD pair (data feed from Kraken).
- The pair could start another increase if it clears the $94,200 zone.
Bitcoin Price Starts Downside Correction
Bitcoin price remained stable above the $90,000 level and started a fresh increase . BTC was able to climb above the $91,500 and $94,000 resistance levels.
The bulls were able to pump the price above the $94,500 resistance. The recent high was formed at $95,348 and the price started a downside correction. There was a drop below the $94,500 and $94,000 levels. A low was formed at $92,900 and the price is now consolidating losses below the 23.6% Fib retracement level of the downward move from the $95,348 swing high to the $92,900 low.
Bitcoin price is now trading below $94,000 and the 100 hourly Simple moving average . There is also a connecting bearish trend line forming with resistance at $94,000 on the hourly chart of the BTC/USD pair.
On the upside, immediate resistance is near the $93,650 level. The first key resistance is near the $94,000 level. The next key resistance could be $94,150 and the 50% Fib retracement level of the downward move from the $95,348 swing high to the $92,900 low.
A close above the $94,150 resistance might send the price further higher. In the stated case, the price could rise and test the $94,500 resistance level. Any more gains might send the price toward the $95,500 level.
More Losses In BTC?
If Bitcoin fails to rise above the $94,000 resistance zone, it could continue to move down. Immediate support on the downside is near the $92,800 level. The first major support is near the $92,000 level.
The next support is now near the $91,500 zone. Any more losses might send the price toward the $90,500 support in the near term. The main support sits at $90,000.
Technical indicators:
Hourly MACD – The MACD is now gaining pace in the bearish zone.
Hourly RSI (Relative Strength Index) – The RSI for BTC/USD is now below the 50 level.
Major Support Levels – $92,800, followed by $92,000.
Major Resistance Levels – $94,000 and $94,150.
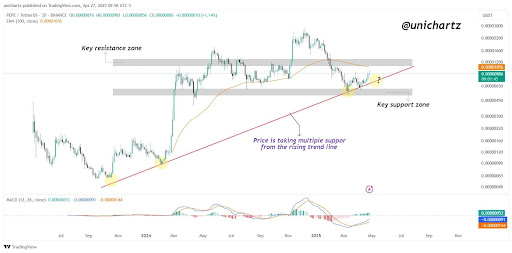
PEPE Rising Trendline Holds Firm: A Reliable Launchpad For Price Rally
UniChartz recently pointed out on X that PEPE is respecting a rising trendline with remarkable consi...
Best Altcoins to Buy as Strategy Buying Spree Is Turning Bitcoin Into a Premium Asset
Strategy (formerly MicroStrategy) currently owns an astounding 538,200 Bitcoin after it added a mass...
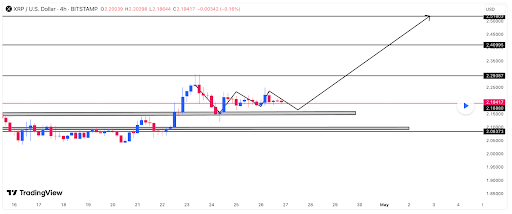
XRP Price Shoots For 20% Surge To $2.51 Amid Pullback To Breakout Zone
The XRP price is eyeing a surge of 20% as it looks to reach a major resistance zone at $2.50, provid...