Bitcoin Price Forecast: Can a Global Liquidity Recovery Trigger a Bitcoin Rally?


The post Bitcoin Price Forecast: Can a Global Liquidity Recovery Trigger a Bitcoin Rally? appeared first on Coinpedia Fintech News
Currently, the Bitcoin market stands at least 22.94% below the all-time peak, and is around 1.84% below the closing price of March 1. This month, the US share market has also experienced a decline of 6%. Experts blame the sharp drop in the global liquidity for the downtrend in the markets. However, reports suggest that the global liquidity has touched its bottom. Could Bitcoin see a reversal? Here is what you should know!
Why Experts Believe Bitcoin May Reverse Soon
Reports suggest that the global liquidity has bottomed. This indicates that the liquidity is likely to start increasing soon.
According to experts, there is a 80% correction between Bitcoin and global liquidity. A correlation of 80% is very high. This means that there is an 80% probability that the price of Bitcoin will go up if the global liquidity improves.
Key Indicators to Watch for a Bitcoin Price Rally
Here are the basic indicators that one should watch:
Resistance Level
Currently, the Bitcoin price stands at $84,185.01. Analysts points to resistance around $87K, $90K, $92,500, $94K, $95K and even $100K. When BTC breaks through these levels with strong trading volume, it suggests that buyers are overcoming selling pressure.
Bitcoin Exchanges’ Net Flow
When investors move their Bitcoin away from exchanges, it often suggests they are confident about the long term potential of the asset. Therefore, it is important to monitor the flow of Bitcoin onto and off cryptocurrency exchanges .
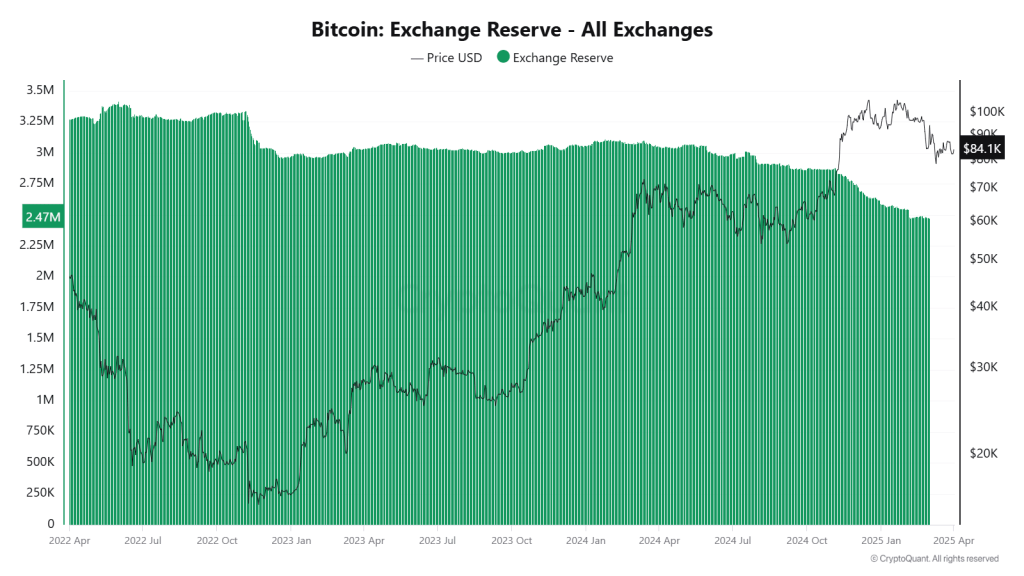
According to Coinglass, the total exchange balance of BTC sits at 2,197,123.37. Its 24-hour change is +16629.17 and its 7-day change is -7184.75. Yesterday, the Bitcoin Wallet net flow was +3.81K BTC.
- Also Read :
- Will BlackRock’s New Bitcoin ETP Drive Crypto Adoption in Europe?
- ,
Technical Indicators
A golden cross , where a shorter-term moving average crosses above a longer-term one is often seen as a bullish signal. The SMA-50 of BTC remains at $88,254.66, and the SMA-200 of the asset stands at $86,180.45.
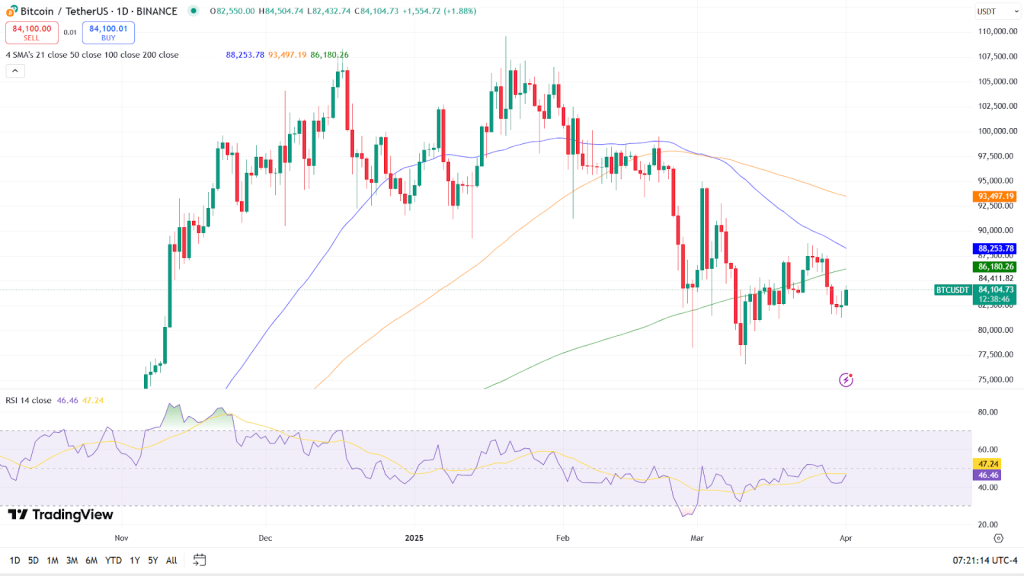
BTC’s RSI remains at 46.57. If the RSI moves consistently above the neutral 50 level and heads towards overbought territory (above 70), it can indicate increasing buying momentum.
In conclusion, with global liquidity showing signs of recovery, Bitcoin could be poised for an upward move .
Never Miss a Beat in the Crypto World!
Stay ahead with breaking news, expert analysis, and real-time updates on the latest trends in Bitcoin, altcoins, DeFi, NFTs, and more.
FAQs
As global liquidity recovers, Bitcoin prices are expected to rise due to the high correlation between liquidity and Bitcoin’s value.
As per Coinpedia’s BTC price prediction, 1 BTC could peak at $169,046 this year if the bullish sentiment sustains.

Stablecoins Associated with First Digital Trust (FDT) Temporarily Depegs as Justin Sun Warns of Company’s Insolvency
The post Stablecoins Associated with First Digital Trust (FDT) Temporarily Depegs as Justin Sun Warn...
Trump Tariffs Live: Bitcoin Price Rallies To $87000 On ‘Liberation Day’
The post Trump Tariffs Live: Bitcoin Price Rallies To $87000 On ‘Liberation Day’ appeared first on C...
Grayscale Announces Launch of Two New Bitcoin ETFs: Here’s What They Are
The post Grayscale Announces Launch of Two New Bitcoin ETFs: Here’s What They Are appeared first on ...