Solana Price Prediction for March 31: Can SOL Break Above $130 After 40% Annual Drop?


- Solana trades at $124.34, down 40% annually, with weak bullish technical signals.
- RSI and MACD hint at slight recovery, but momentum remains in bearish territory.
- Trading volume surged 78.57% to $2.94B, indicating increased investor activity.
Solana (SOL) , one of the leading cryptocurrencies by market capitalization, has shown a small recovery in daily price movement. However, the general outlook remains cautious as technical indicators reflect downward pressure.
As of press time, SOL was trading at $124.34, with recent chart data pointing to short-term stabilization rather than a full reversal. While Solana, the sixth largest cryptocurrency based on market capitalization, is struggling to build long-term investment, it revealed a 40% loss in its annual chart.
Recent technical analysis shows limited strength in Solana’s momentum. The Relative Strength Index (RSI) stands at 37.90, still below the neutral 50 threshold. While the RSI has slightly gained from recent lows and is trending toward its 14-day moving average of 33.57, the current level remains in bearish territory.

Source: TradingView
The Moving Average Convergence Divergence (MACD) shows a similar picture. Bullish formation is week with the MACD line at -2.45, slightly crossing the signal line above at -2.76. The histogram has brought a value of 0.32, which indicates a possibility of an upward movement of the price.
The coin’s technical chart remains in the bearish zone, remaining below the 100-DMA and the 200-DMA. Such signs mean the decline is unlikely to stop unless there is a wider change in the market environment.
Trading Volume Sees Sharp Surge
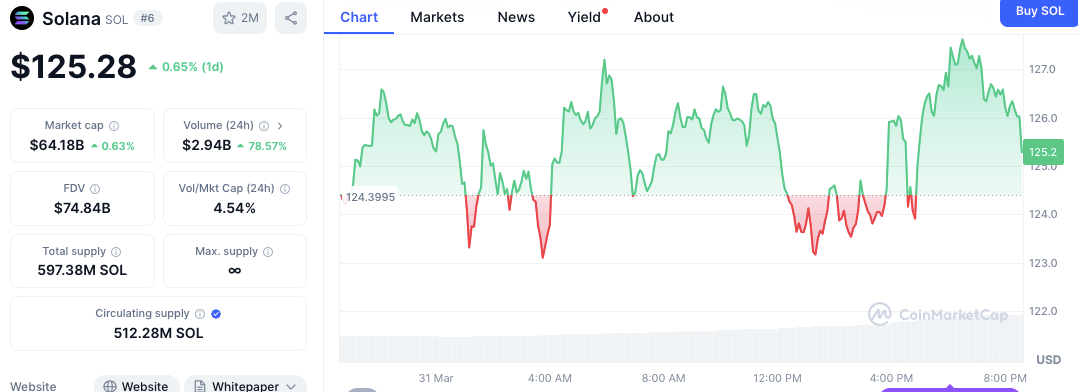
Despite the technical considerations, Solana has shown a rise in the trading volume. The trading activity escalated by 78.57% in the last 24 hours at $2.94 billion. The volume has also risen, and the volume-to-market cap ratio has been obtained at 4a .54%, meaning high investor engagement. The current market capitalization is $64.18 billion, with a fully diluted valuation of $74.84 billion.

Source: CoinMarketCap
SOL’s price experienced intraday volatility, dropping below $124 during early trading before rebounding above $127 in the afternoon. It finally closed with a daily increase of 0.65%. While fluctuations remain, the price has largely trended upward throughout the day.
Market Context and Supply Overview
Solana’s circulating supply is currently reported at 512.28 million SOL out of 597.38 million. The token does not have a maximum supply cap. The price remains below key resistance levels, particularly the $130 mark, which has acted as previous support.
The bearish impact on primary digital assets continues to affect Solana’s market performance, although the network remains stable. Several indicators point toward modest recovery signs yet fail to signal a complete turnaround.
FAQs:
Why is Solana (SOL) facing downward pressure despite a daily price uptick?
Solana remains below key technical indicators like the 100-day and 200-day moving averages. RSI and MACD readings continue to reflect bearish momentum.
What caused the recent surge in Solana’s trading volume?
Solana’s 24-hour trading volume jumped 78.57% to $2.94 billion, likely due to increased short-term investor activity. The volume-to-market cap ratio also rose to 4.54%.
Is Solana showing signs of a full price recovery?
No, current indicators suggest only mild recovery signals. A full reversal is unlikely without stronger momentum and a break above resistance near $130.

KOR Protocol to Release Avalanche L1 to Offer On-Chain AAA Entertainment IP
By launching its separate Avalanche L1 blockchain, KOR Protocol promises an exclusive level of trans...

Binance Introduces New Feature to Minimize Slippage
As per Binance, it is unveiling Spot Block Matching to improve the experience of the institutional a...

Crypto Market Holds Steady as $BTC Hits $82,959 and $ETH Rises
Bitcoin ($BTC) $82,959 and Ethereum ($ETH) touches $1,843 as market sentiment remains cautious with ...

