Bitcoin Surge Fueled by $32B in Open Interest—Here’s What Could Happen Next


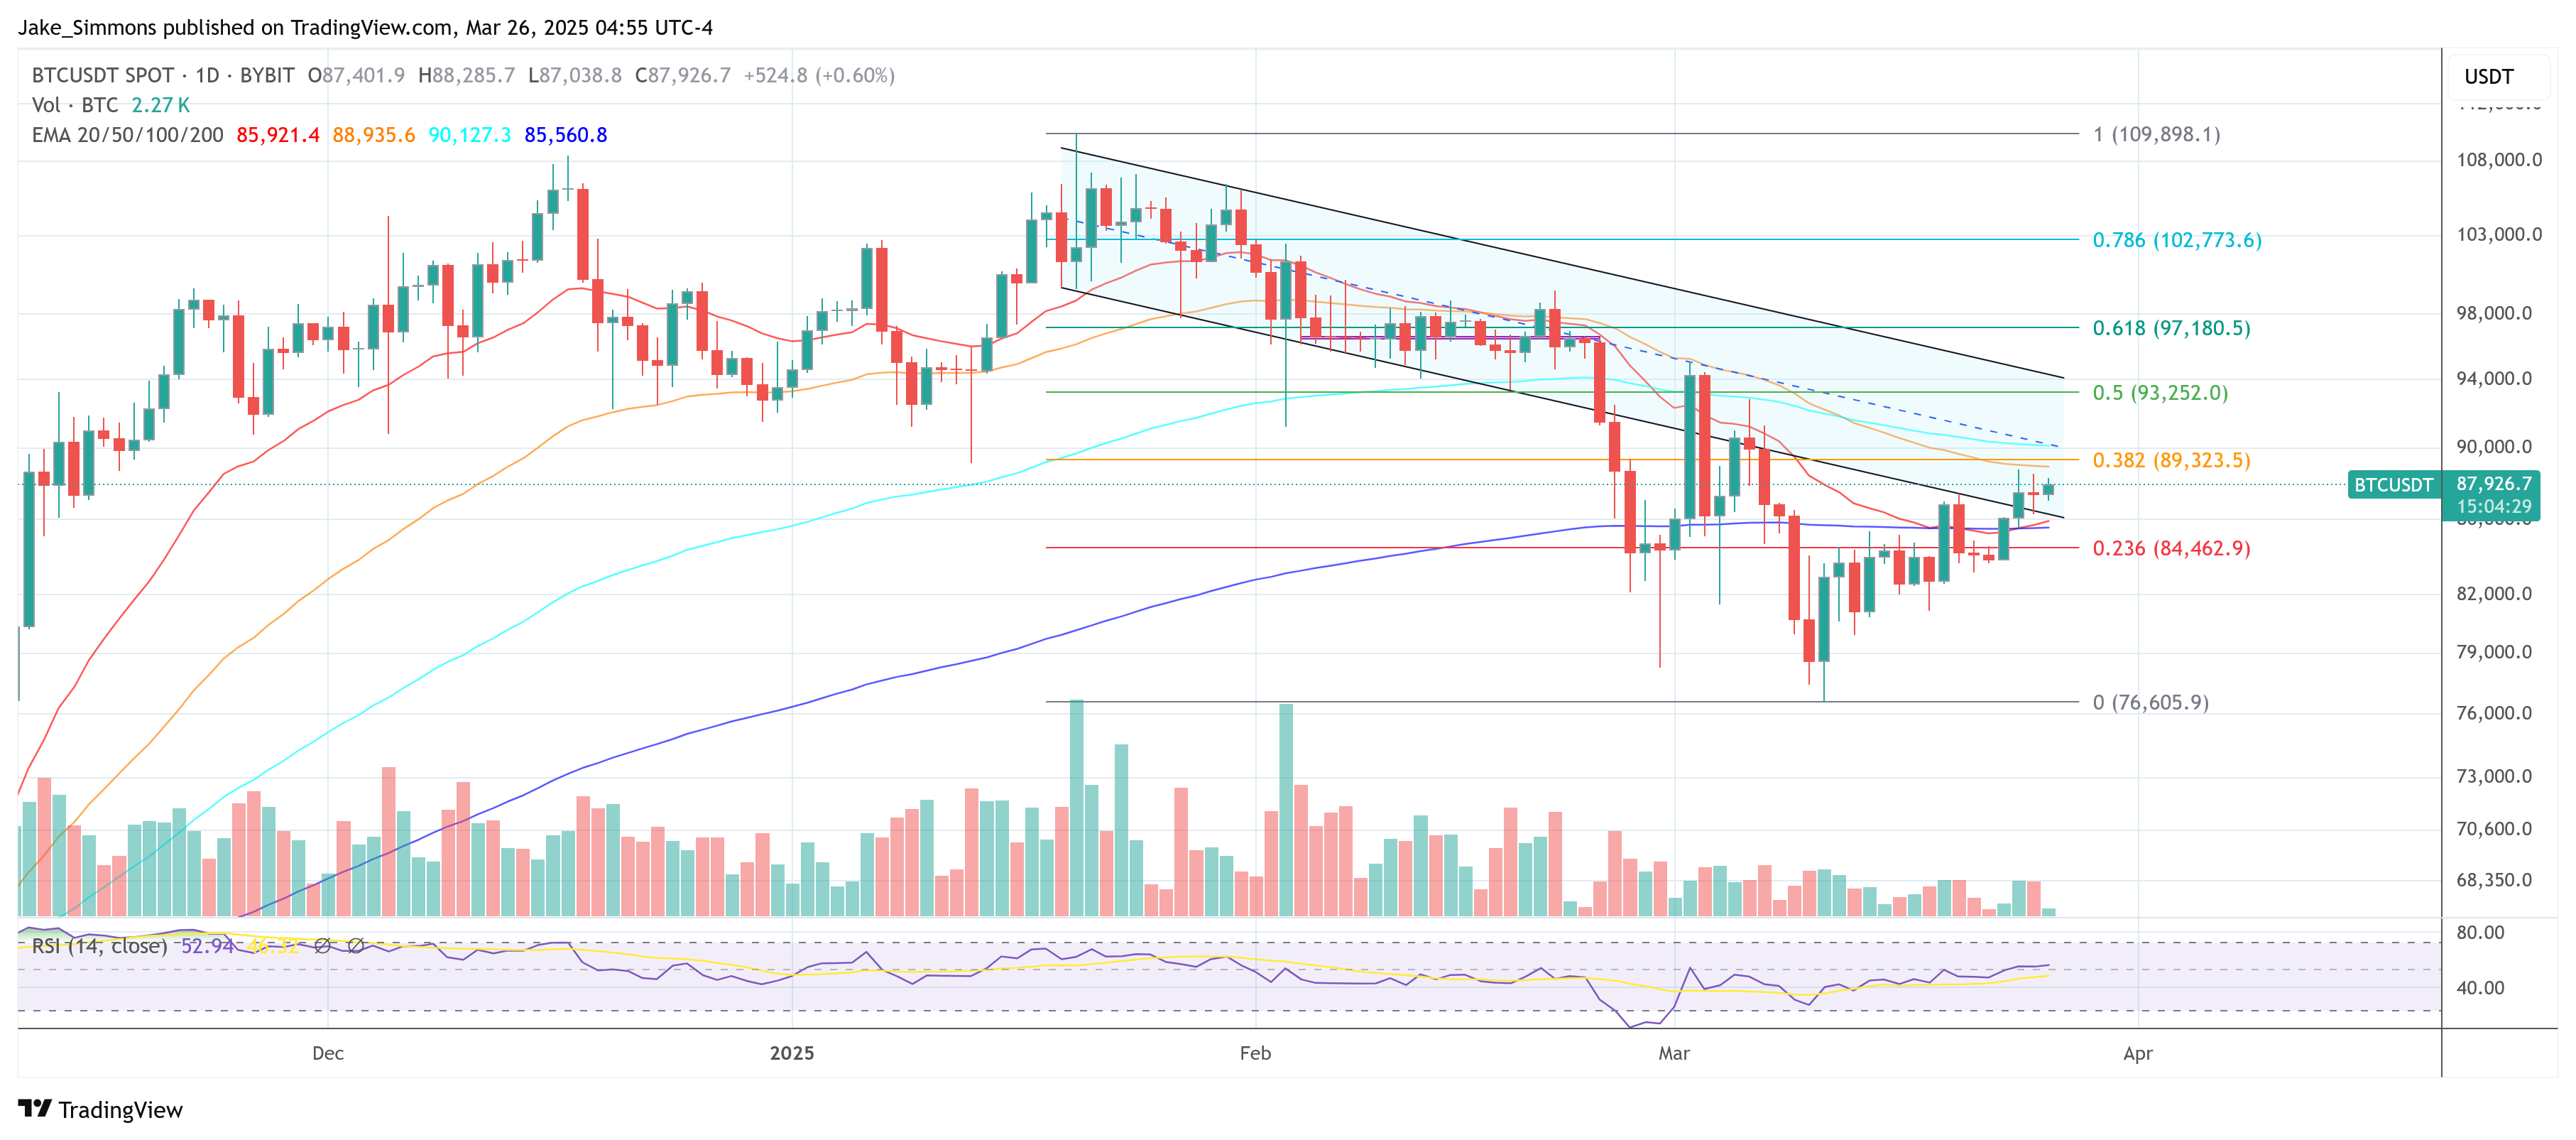
Bitcoin opened the week with a strong rebound, climbing back above the $88,000 mark for the first time in several weeks. As of today, BTC trades at approximately $88,025, representing a 6.2% increase over the past week.
This recovery follows a volatile period where the asset experienced significant resistance below the $85,000 price level. While this upward price action has brought renewed optimism to the market, analysts are also highlighting underlying factors that could influence Bitcoin’s near-term direction .
One of the most notable trends is a spike in leverage, signaling that derivative traders may be playing a larger role in driving price movements.
Bitcoin Open Interest Surges, Signaling High-Leverage Activity
According to on-chain data shared by CryptoQuant analyst IT Tech, Bitcoin’s Open Interest (OI) has reached a record high above $32 billion. Open Interest refers to the total value of outstanding derivative contracts—such as futures and options—that have not yet been settled.
A rising OI alongside a rising price can indicate growing bullish sentiment , but it can also be a signal of increased risk if the market becomes overly leveraged.

IT Tech noted that while the rally has sparked enthusiasm, it comes with a caveat. “High OI combined with rapid price increase often leads to liquidation cascades if the trend reverses,” the analyst wrote.
If bulls fail to maintain momentum, over-leveraged positions may be liquidated, triggering a sharp correction. Monitoring sudden shifts in OI and price will be critical in the coming days.
BTC Market Alert: Leverage-driven pump
“Open Interest (OI) hit record levels above $32B as BTC price surges near $87.5K.
But here’s the catch: High OI + Rapid Price Increase = Risk of Liquidation Cascades!” – By @IT_Tech_PL
Full post
https://t.co/BzEOKHgPLI pic.twitter.com/DHL0MGedSR
— CryptoQuant.com (@cryptoquant_com) March 24, 2025
Mixed Signals from Analysts on What’s Next
Despite concerns over leverage, some analysts remain optimistic. Javon Marks, a technical analyst active on X, suggested that Bitcoin may be in the early stages of another major breakout. “Bitcoin looks to be working on another massive bullish breakout,” Marks said, adding that altcoins could soon follow suit.
On the other hand, analyst Ali offered a more cautious outlook, citing the TD Sequential indicator as a potential sign of an upcoming short-term top.
He highlighted key price levels for traders to watch, pointing to a significant support zone between $82,590 and $85,150, where over 625,000 BTC were previously accumulated. Meanwhile, resistance looms between $95,400 and $97,970, a region that could see strong selling pressure due to past investor activity.

Featured image created with DALL-E, Chart from TradingView
Meltem Demirors On Crypto Rally: ‘Are We So Back? Not So Fast’
Over the past two weeks, Bitcoin and the broader crypto market have seen a slight recovery. However,...

Bitcoin Rally To $95K? Market Greed Suggests It’s Possible
Bitcoin is on everyone’s crosshairs once more. The cryptocurrency shot up to $88,500 today, exciting...
Now Is The Best Time To Buy Bitcoin, Says Investment Giant
In its latest investor memo, titled “The Great Derisking of Bitcoin,” Bitwise Asset Management has t...