Bitcoin Price Shows Stronger Recovery Signs—Upside Move in Focus


Bitcoin price started a recovery wave above the $82,500 zone. BTC is now rising and might aim for a move above the $86,500 and $87,200 levels.
- Bitcoin started a decent recovery wave above the $83,000 zone.
- The price is trading above $84,500 and the 100 hourly Simple moving average.
- There is a connecting bullish trend line forming with support at $85,200 on the hourly chart of the BTC/USD pair (data feed from Kraken).
- The pair could start another increase if it clears the $86,200 and $87,000 levels.
Bitcoin Price Eyes Steady Increase
Bitcoin price remained stable above the $82,000 level. BTC formed a base and recently started a recovery wave above the $83,500 resistance level.
The bulls pushed the price above the $85,000 resistance level. However, the bears were active near the $86,500 resistance zone. A high was formed at $85,591 and the price corrected some gains . There was a move below the $85,000 level.
The price dipped below the 23.6% Fib retracement level of the upward move from the $83,667 swing low to the $85,591 high. Bitcoin price is now trading above $85,200 and the 100 hourly Simple moving average. There is also a connecting bullish trend line forming with support at $85,200 on the hourly chart of the BTC/USD pair.
On the upside, immediate resistance is near the $86,000 level. The first key resistance is near the $86,500 level. The next key resistance could be $87,200. A close above the $87,200 resistance might send the price further higher. In the stated case, the price could rise and test the $88,500 resistance level. Any more gains might send the price toward the $88,800 level or even $90,000.
Another Drop In BTC?
If Bitcoin fails to rise above the $86,500 resistance zone, it could start a fresh decline. Immediate support on the downside is near the $85,500 level. The first major support is near the $85,200 level or the 50% Fib retracement level of the upward move from the $83,667 swing low to the $85,591 high.
The next support is now near the $84,500 zone. Any more losses might send the price toward the $83,000 support in the near term. The main support sits at $81,500.
Technical indicators:
Hourly MACD – The MACD is now gaining pace in the bullish zone.
Hourly RSI (Relative Strength Index) – The RSI for BTC/USD is now above the 50 level.
Major Support Levels – $85,500, followed by $85,200.
Major Resistance Levels – $86,500 and $87,200.

Dogecoin Is ‘All Going To Plan,’ Says Crypto Analyst
Crypto analyst Kevin has provided an update on Dogecoin’s price structure, highlighting how multiple...
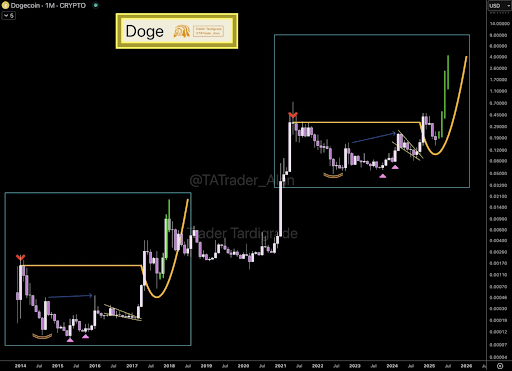
Dogecoin Price Mirroring This 2017 Pattern Suggests That A Rise To $4 Could Happen
Crypto analyst KrissPax has revealed that the Dogecoin price is mirroring a pattern from a previous ...

XRPL Hits 2.8 Billion Flawless Transactions—Big Players Are Paying Attention
Blockchain technology is receiving a boost with the XRP Ledger, based on recent findings from indust...