XRP Price Eyes Upside—Stronger Recovery Odds Compared to BTC


XRP price started a fresh recovery wave from the $1.90 zone. The price is now consolidating and might struggle to clear the $2.10 resistance zone.
- XRP price started a fresh decline from the $2.250 resistance zone.
- The price is now trading below $2.20 and the 100-hourly Simple Moving Average.
- There is a connecting bearish trend line forming with resistance at $2.06 on the hourly chart of the XRP/USD pair (data source from Kraken).
- The pair might continue to move up if it clears the $2.10 resistance zone.
XRP Price Dips Further
XRP price started a fresh decline after it failed to clear the $2.250 zone, like Bitcoin and Ethereum . The price declined below the $2.10 and $2.050 support levels.
The bears even pushed the price below $2.00. A low was formed at $1.90 and the price is now attempting to recover. There was a move above the $1.950 and $1.980 resistance levels. The price surpassed the 23.6% Fib retracement level of the downward move from the $2.260 swing high to the $1.90 low.
The price is now trading below $2.20 and the 100-hourly Simple Moving Average. On the upside, the price might face resistance near the $2.060 level. There is also a connecting bearish trend line forming with resistance at $2.06 on the hourly chart of the XRP/USD pair.
The first major resistance is near the $2.080 level or the 50% Fib retracement level of the downward move from the $2.260 swing high to the $1.90 low. The next resistance is $2.120. A clear move above the $2.120 resistance might send the price toward the $2.1750 resistance. Any more gains might send the price toward the $2.20 resistance or even $2.250 in the near term. The next major hurdle for the bulls might be $2.450.
Another Decline?
If XRP fails to clear the $2.080 resistance zone, it could start another decline. Initial support on the downside is near the $1.950 level. The next major support is near the $1.90 level.
If there is a downside break and a close below the $1.850 level, the price might continue to decline toward the $1.80 support. The next major support sits near the $1.750 zone.
Technical Indicators
Hourly MACD – The MACD for XRP/USD is now losing pace in the bearish zone.
Hourly RSI (Relative Strength Index) – The RSI for XRP/USD is now below the 50 level.
Major Support Levels – $1.950 and $1.900.
Major Resistance Levels – $2.080 and $2.1750.
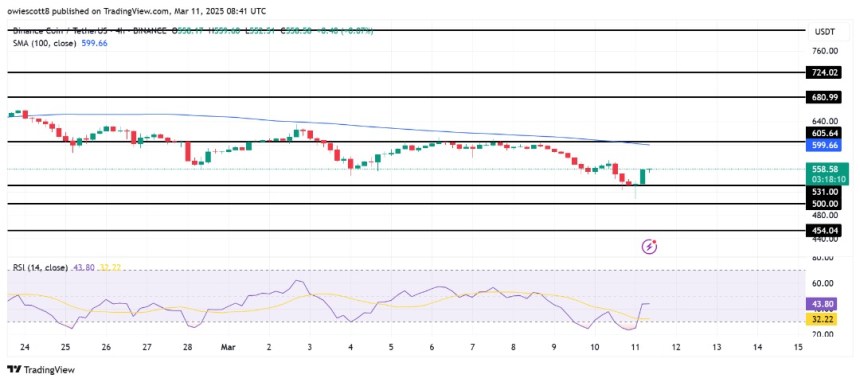
BNB Bulls Take Charge: Price Rebounds Strongly After Recent Dip
BNB is making a strong comeback as bullish momentum picks up following a recent dip, sparking renewe...
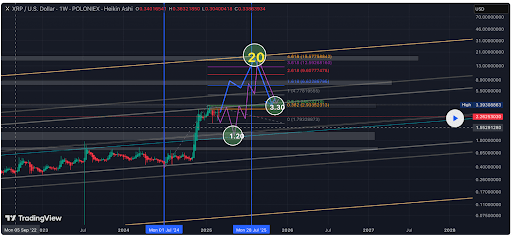
XRP Price Face Major Resistance At $2.9, Why This Analyst Believes $20 Is Still Possible
Crypto analyst ElmoX has asserted that the XRP price is still bullish despite the recent crypto mark...

The ECB Pushes for Digital Euro. Time to Invest in the Best Wallet Token?
Christine Lagarde, President of the European Central Bank, said that the ECB is aggressively pursuin...