Bitcoin Price Retreats—Key Support Levels in Focus After Reversal


Bitcoin price started a fresh decline from the $95,000 resistance zone. BTC is back below $90,000 and might continue to move down.
- Bitcoin started a fresh decline from the $95,000 resistance zone.
- The price is trading below $92,000 and the 100 hourly Simple moving average.
- There was a break below a connecting bullish trend line with support at $88,000 on the hourly chart of the BTC/USD pair (data feed from Kraken).
- The pair could start another decline if it fails to stay above the $82,250 zone.
Bitcoin Price Dips Over 10%
Bitcoin price rallied above the $88,000 and $90,000 resistance levels . BTC tested the $95,000 resistance where it faced a strong resistance. The price failed to retain gains and started a fresh decline below $92,000.
There was a move below the $92,000 and $90,000 support levels. The price dived over 10% and traded below the 50% Fib retracement level of the upward move from the $84,500 swing low to the $95,000 high. There was also a break below a connecting bullish trend line with support at $88,000 on the hourly chart of the BTC/USD pair.
Bitcoin price is now trading below $90,000 and the 100 hourly Simple moving average . On the upside, immediate resistance is near the $85,000 level. The first key resistance is near the $86,600 level.
The next key resistance could be $88,500. A close above the $88,500 resistance might send the price further higher. In the stated case, the price could rise and test the $90,000 resistance level. Any more gains might send the price toward the $92,000 level or even $93,500.
More Losses In BTC?
If Bitcoin fails to rise above the $88,000 resistance zone, it could start a fresh decline. Immediate support on the downside is near the $82,250 level and the 76.4% Fib retracement level of the upward move from the $84,500 swing low to the $95,000 high. The first major support is near the $80,000 level.
The next support is now near the $78,500 zone. Any more losses might send the price toward the $76,000 support in the near term. The main support sits at $75,000.
Technical indicators:
Hourly MACD – The MACD is now gaining pace in the bearish zone.
Hourly RSI (Relative Strength Index) – The RSI for BTC/USD is now below the 50 level.
Major Support Levels – $82,250, followed by $80,000.
Major Resistance Levels – $88,000 and $90,000.
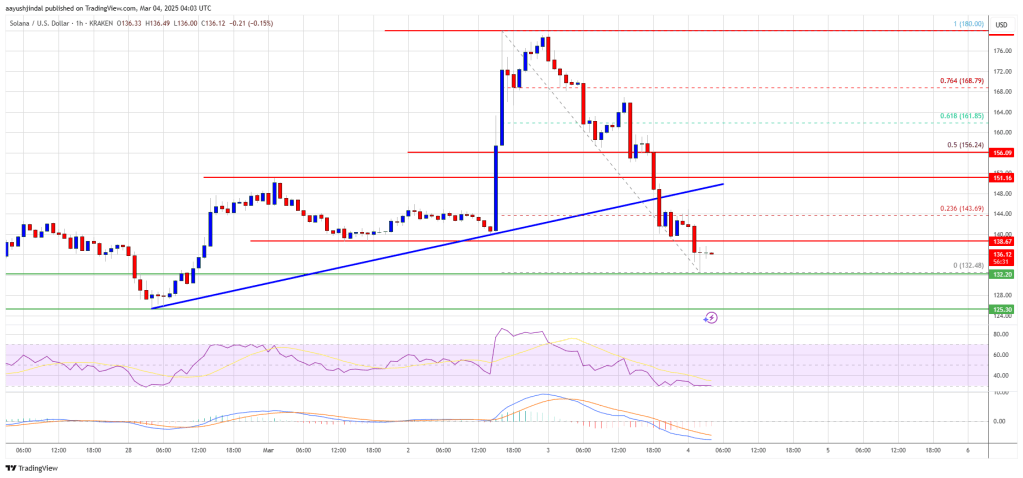
Solana (SOL) Plunges 20%—Key Support Levels Now in Focus
Solana started a fresh decline from the $180 zone. SOL price is down over 20% and might struggle to ...
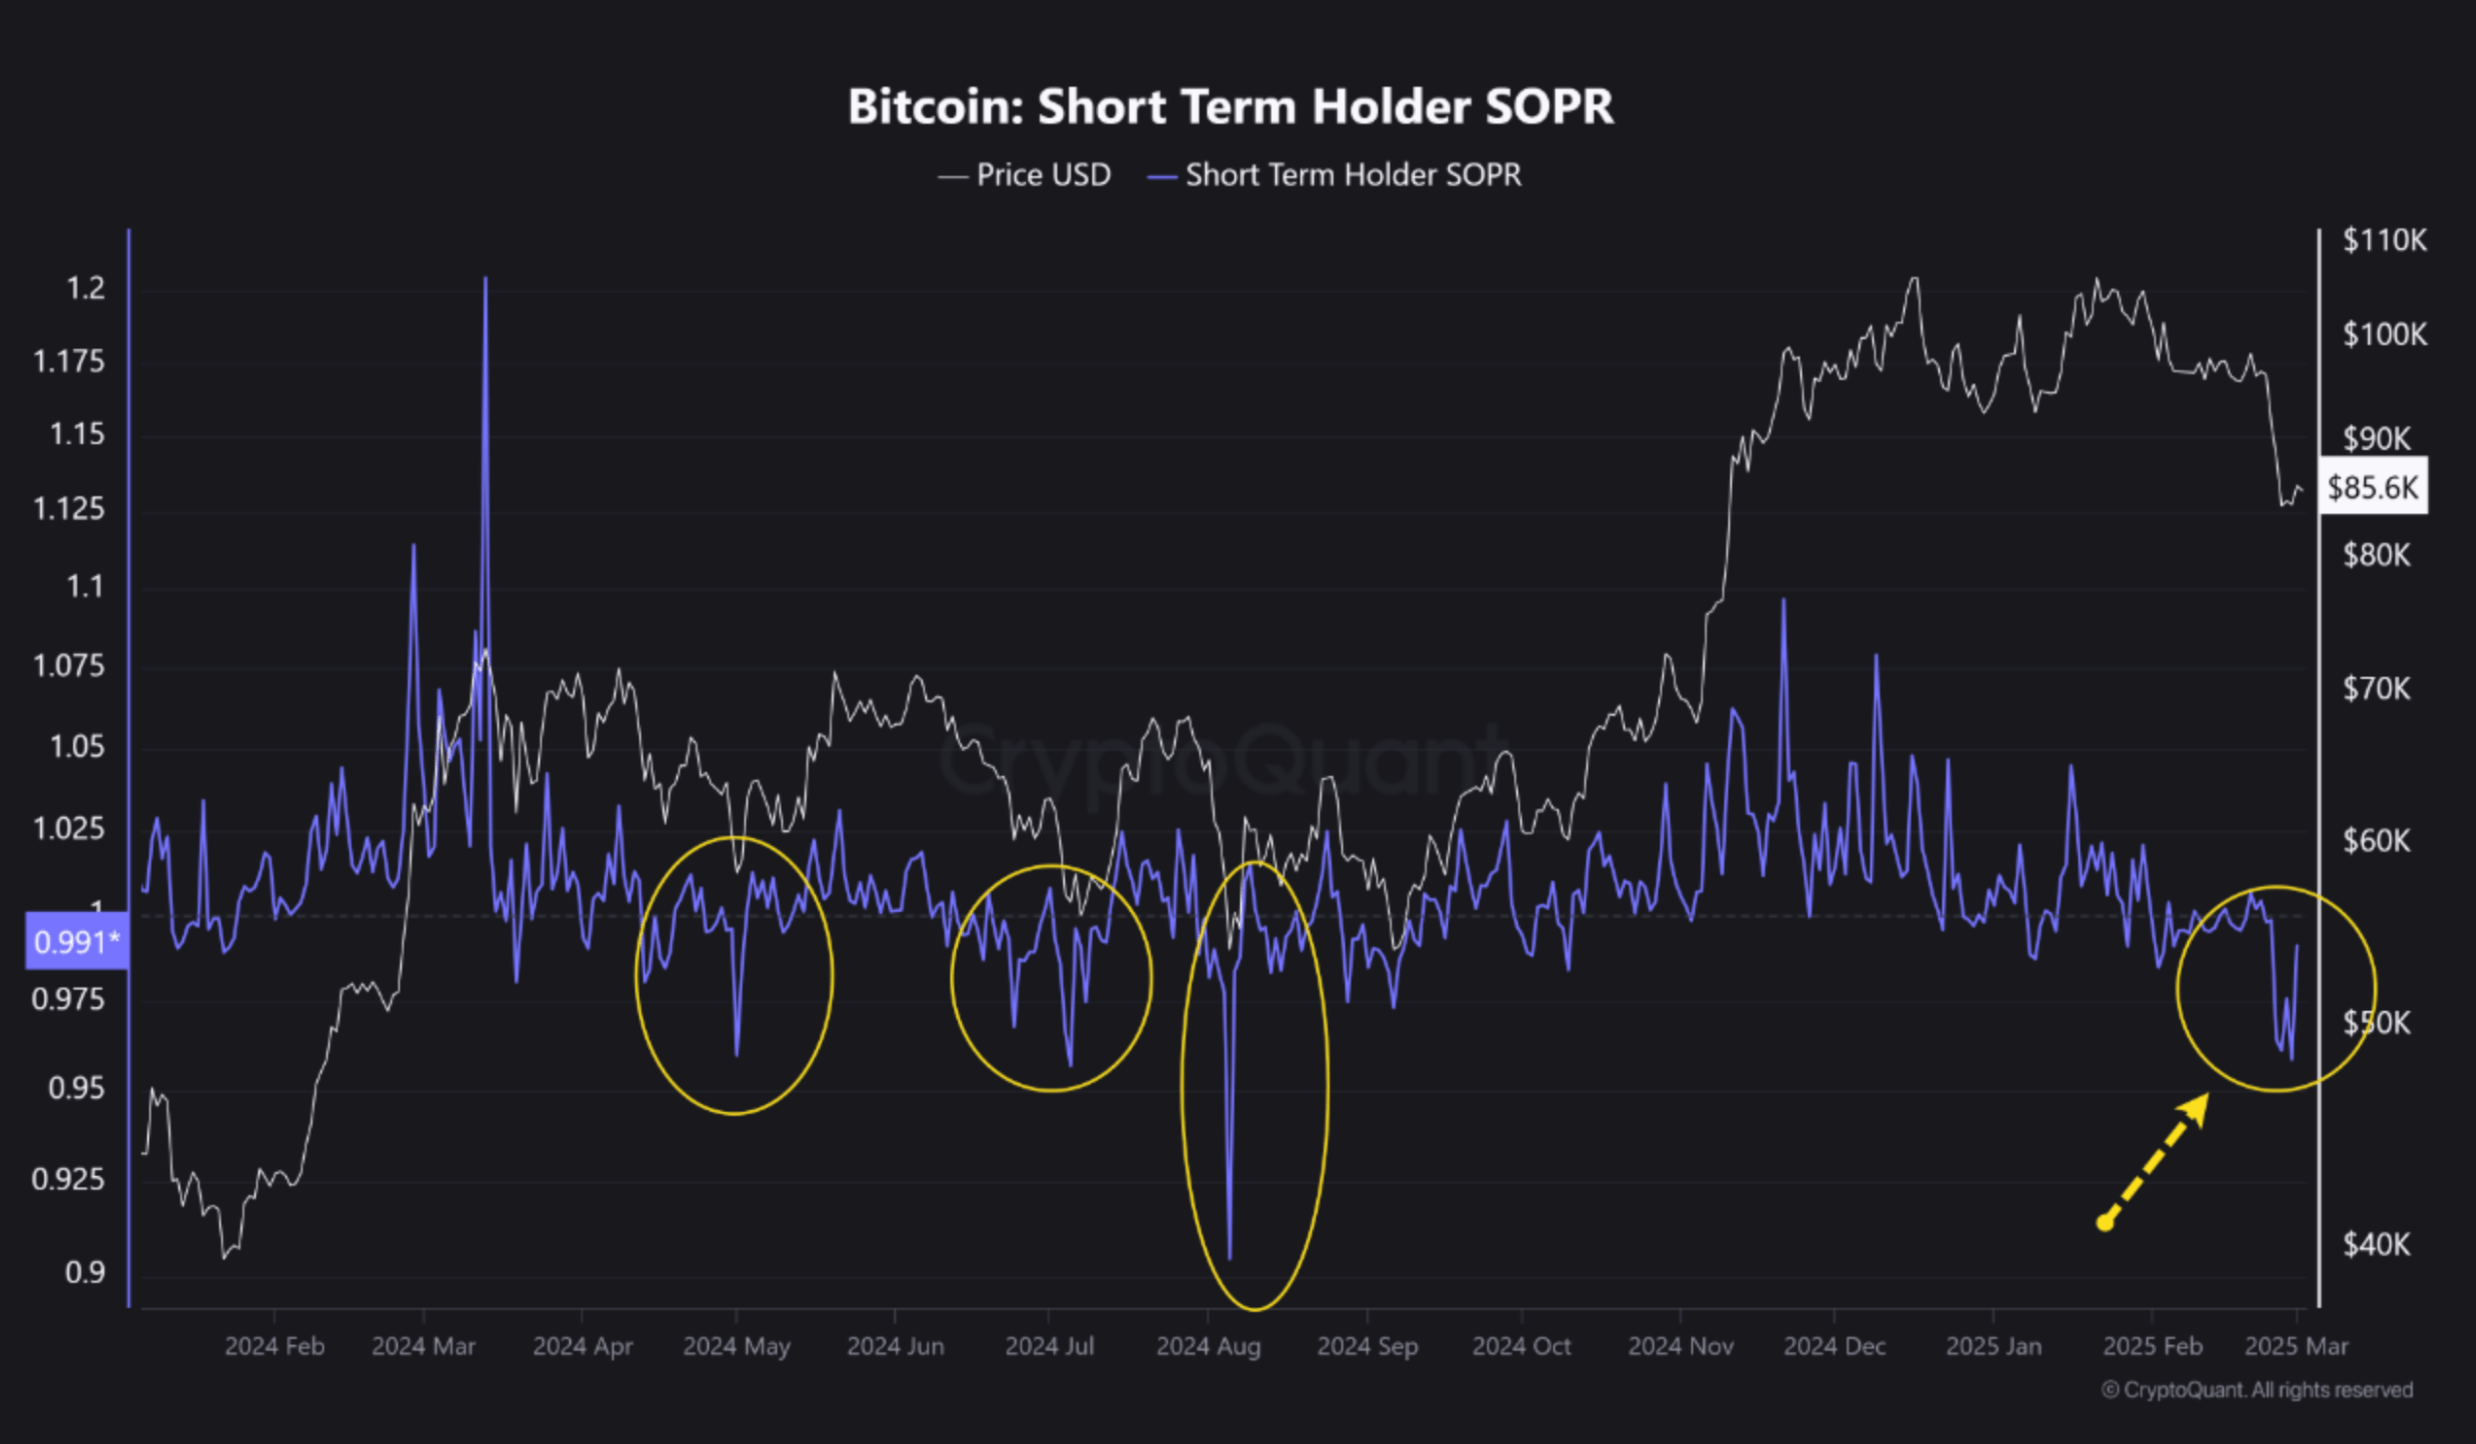
Bitcoin Sellers Incur Loss As SOPR Drops To 0.95 – A Sign Of Market Bottom?
According to a recent Quicktake post by CryptoQuant analyst abramchart, short-term Bitcoin (BTC) inv...
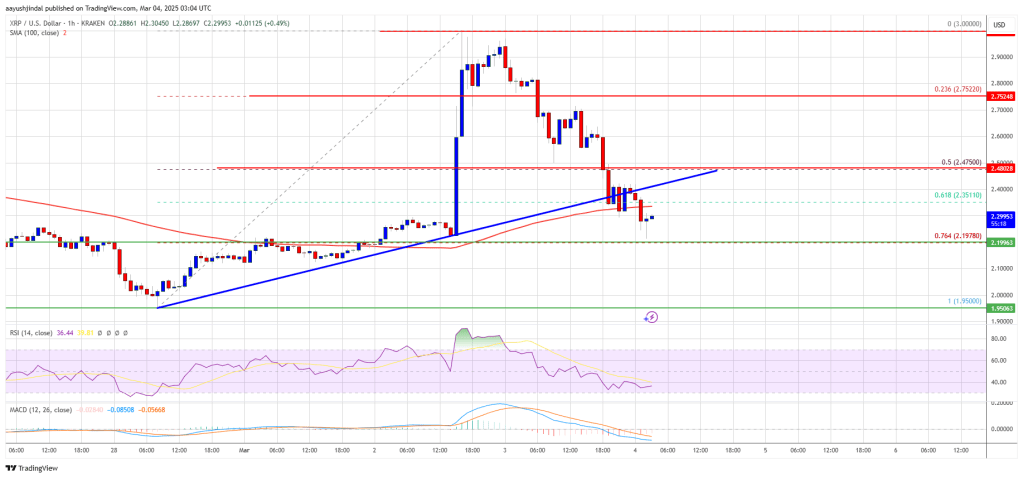
XRP Rally Fades—Price Surrenders Recent Gains
XRP price started a fresh decline from the $3.00 resistance. The price is up down over 20% and might...