
Solana (SOL) at a Crossroads: Can It Break Through and Turn Bullish?


Solana started a fresh decline from the $220 zone. SOL price is consolidating and might face resistance near the $215 and $220 levels.
- SOL price started a fresh decline below the $215 and $212 levels against the US Dollar.
- The price is now trading below $212 and the 100-hourly simple moving average.
- There is a short-term declining channel or a bullish flag forming with resistance at $213 on the hourly chart of the SOL/USD pair (data source from Kraken).
- The pair could start a fresh increase if the bulls clear the $220 zone.
Solana Price Faces Resistance
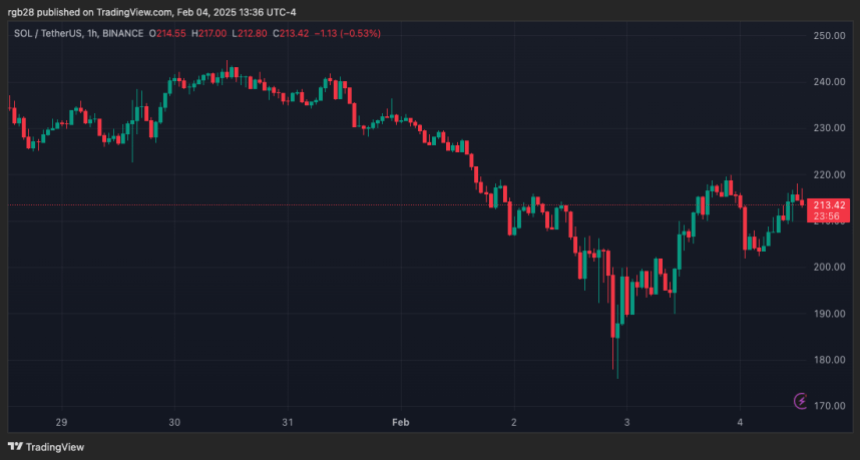
Solana price struggled to clear the $250 resistance and started a fresh decline, like Bitcoin and Ethereum . SOL declined below the $220 and $200 support levels.
It even dived below the $180 level. The recent low was formed at $175 before the price climbed and tested the $220 resistance. A high was formed at $220 and the price is now consolidating. There was a drop below the 23.6% Fib retracement level of the upward move from the $175 swing low to the $220 high.
Solana is now trading below $220 and the 100-hourly simple moving average. On the upside, the price is facing resistance near the $212 level. There is also a short-term declining channel or a bullish flag forming with resistance at $213 on the hourly chart of the SOL/USD pair.
The next major resistance is near the $215 level. The main resistance could be $220. A successful close above the $220 resistance zone could set the pace for another steady increase. The next key resistance is $232. Any more gains might send the price toward the $250 level.
Another Decline in SOL?
If SOL fails to rise above the $215 resistance, it could start another decline. Initial support on the downside is near the $202 zone. The first major support is near the $198 level or the 50% Fib retracement level of the upward move from the $175 swing low to the $220 high.
A break below the $198 level might send the price toward the $192 zone. If there is a close below the $192 support, the price could decline toward the $175 support in the near term.
Technical Indicators
Hourly MACD – The MACD for SOL/USD is losing pace in the bullish zone.
Hourly Hours RSI (Relative Strength Index) – The RSI for SOL/USD is below the 50 level.
Major Support Levels – $202 and $198.
Major Resistance Levels – $215 and $220.
Memecoins Crowned As ‘Defining Narrative Of 2024’, What’s The Next Key Sector To Watch?
Memecoins have been the leading narrative of the cycle after surpassing all expectations and becomin...
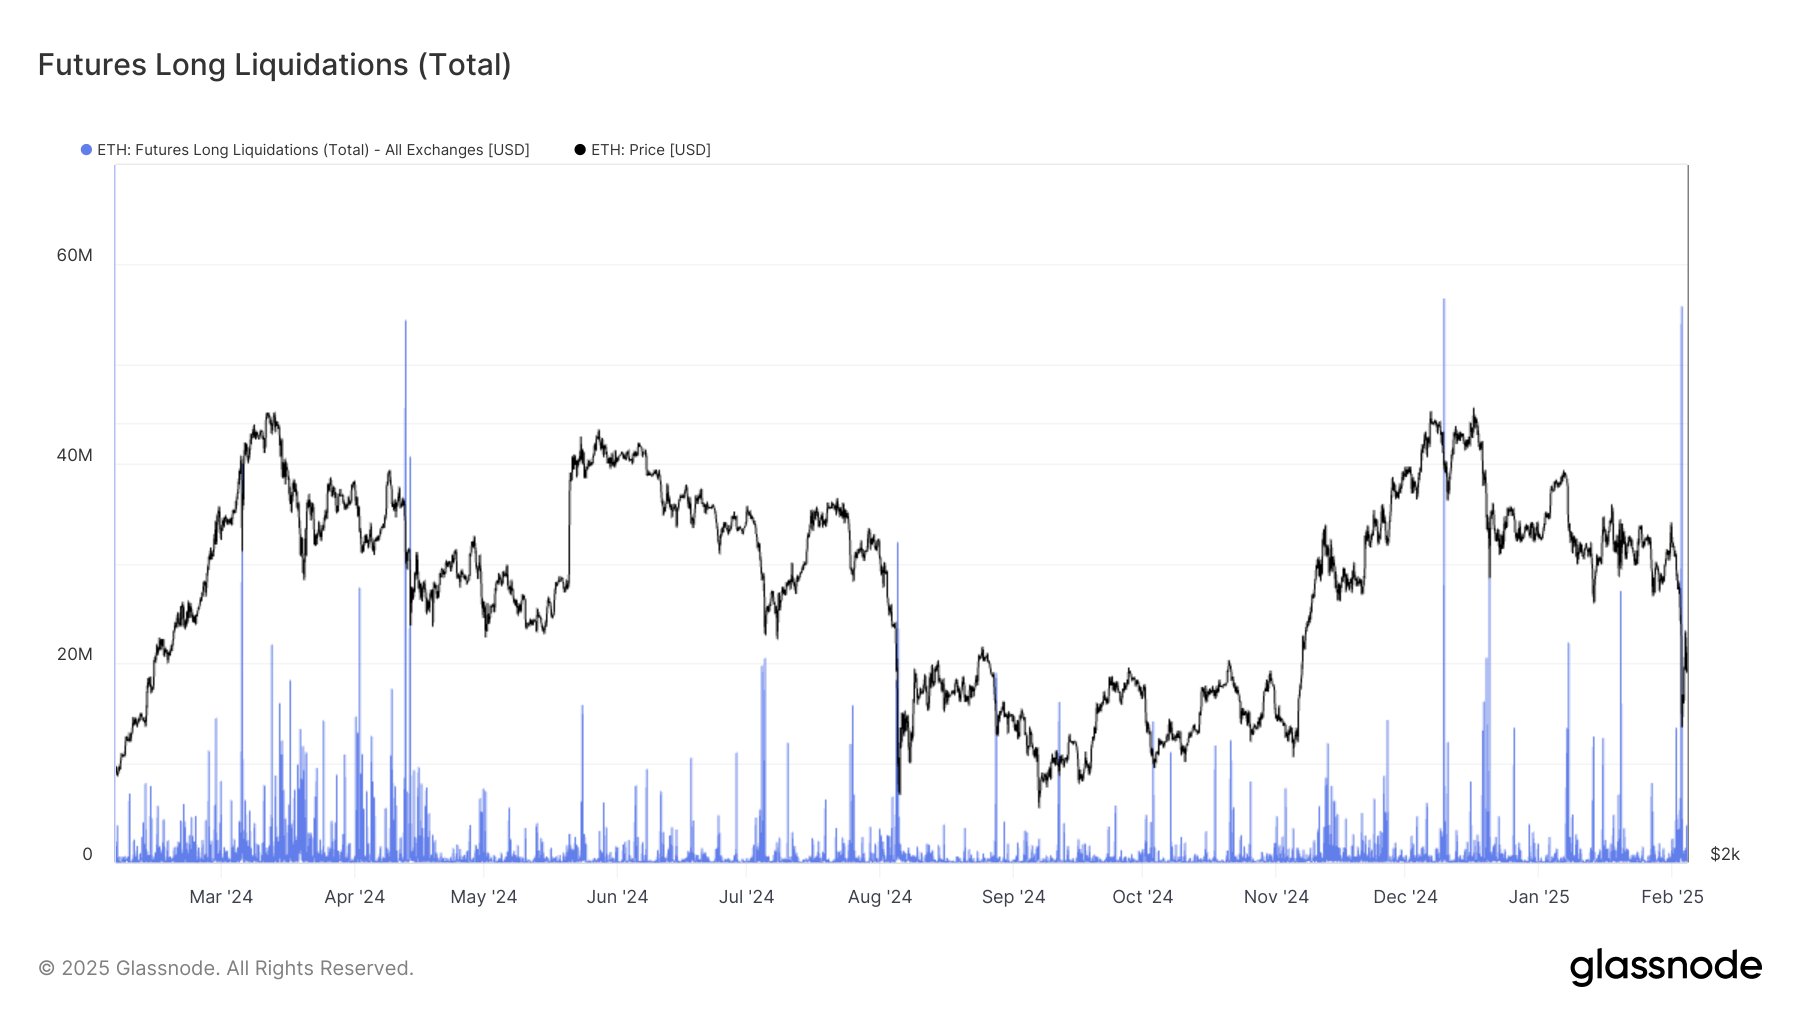
Ethereum Leverage Elevated Despite Long Squeeze, Glassnode Says
The on-chain analytics firm Glassnode has revealed how the Ethereum futures market is still overheat...

XRP Price Tests Critical Barrier: Will Bulls Lose Steam?
XRP price recovered most losses and rallied toward $2.75. The price is now facing hurdles near the $...