Crypto
Moby AI
MOBY
Moby AI
#--

$0.02291
-8.02%
≈$0.02281
Trading Volume / 24H%
$697,116.34
-8.02%
24H Turnover Rate
3.053%
Market Cap
$22.69M
FDV
$22.69M
Circulating Supply
999.97M MOBY
Circulation Ratio
100%
24 Hours
-8.02%
7D
10.62%
3 Months
23.58%
6 Months
132%
1 Year
- -
All
- -
Underlying Chain
Solana
Core Algorithm
Consensus Mechanism
Project Launch Date
Initial Issuance Method
Official Website
Whitepaper
Social Media
Social Media
github
Blockchain Explorer
Blockchain Explorer
Market Cap
$22,686,593.41
Market Cap Ratio
<0.01%
FDV
$22,686,593.41
Circulating Supply
999,966,557 MOBY
Total Supply
999,966,557 MOBY
Circulation Ratio
100%
Maximum Supply
1,000,000,000 MOBY
Trading Start Date
2025-01-14
Number of Listed Exchanges
7
Initial Price
0
Historical Lowest
0.005697
2025-04-08 (Since Launch)
302%
Historical Highest
0.1924
2025-01-23 (Since Launch)
-89%
Today's Range
0.02184
0.02292
7-Day Range
0.01807
0.02568
Price Converter
USD
Project Information
Solana
Unlock Event
SUL
| Date | Unlocked | MCR | Details |
|---|
Related Information
Bitcoin Sharks Are Accumulating Heavily—What This Means for BTC Price
CoinPedia

2025.09.11 10:22
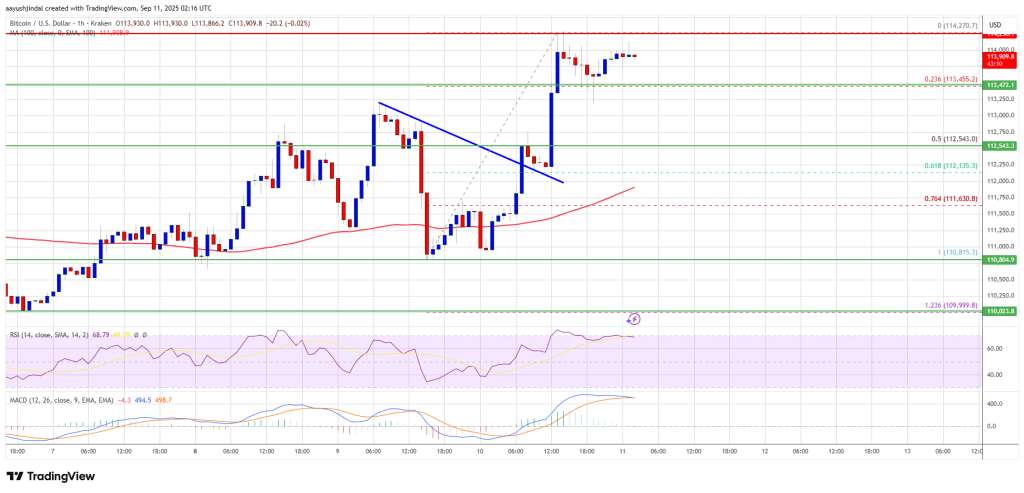
Bitcoin Recovery Builds – Can BTC Turn Momentum Into a Rally?
NewsBTC
2025.09.11 02:27