Crypto
Across Protocol
ACX
Across Protocol
#--

$0.08429
-23.14%
≈$0.08397
Trading Volume / 24H%
$27.4M
-23.14%
24H Turnover Rate
54.267%
Market Cap
$51.67M
FDV
$84.28M
Circulating Supply
613.07M ACX
Circulation Ratio
61.3%
24 Hours
-23.14%
7D
-28.52%
3 Months
-7.1%
6 Months
-58%
1 Year
-69%
All
- -
Underlying Chain
GoPlus
Ethereum,Polygon
Core Algorithm
Consensus Mechanism
Project Launch Date
Initial Issuance Method
Official Website
Whitepaper
Social Media
Social Media
Blockchain Explorer
Blockchain Explorer
Market Cap
$51,667,577.44
Market Cap Ratio
<0.01%
FDV
$84,277,268.62
Circulating Supply
613,066,587 ACX
Total Supply
1,000,000,000 ACX
Circulation Ratio
61.3%
Maximum Supply
1,000,000,000 ACX
Trading Start Date
--
Number of Listed Exchanges
26
Initial Price
0
Historical Lowest
0.03423
2023-06-02 (Since Launch)
146%
Historical Highest
1.6819
2024-12-07 (Since Launch)
-95%
Today's Range
0.04929
0.08475
7-Day Range
0.1101
0.1257
Price Converter
USD
Project Information
Across is a cross-chain bridging solution that enables fast, secure and cost-effective transfers.
It relies on a decentralized set of relayers to fulfill user deposit requests from EVM to the EVM network. Relay funds are insured by liquidity providers in a single pool on Ethereum, and refunds are processed through the UMA Optimistic Oracle.
Unlock Event
SUL
| Date | Unlocked | MCR | Details |
|---|
Related Information
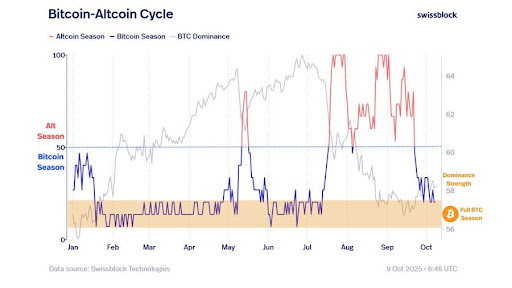
Bitcoin Dominance Dilemma – Why Capital Flows Back To BTC Before Fuelling Altcoin Rally
NewsBTC

2025.10.10 20:00

Bitcoin Price Forecast: Can BTC Hit $145K After October ETF Surge?
CoinPedia
2025.10.10 13:24