Ethereum price started a downside correction below $1,665. ETH must clear the $1,650 and $1,720 resistance levels to continue higher.
- Ethereum started a downside correction below the $1,650 zone.
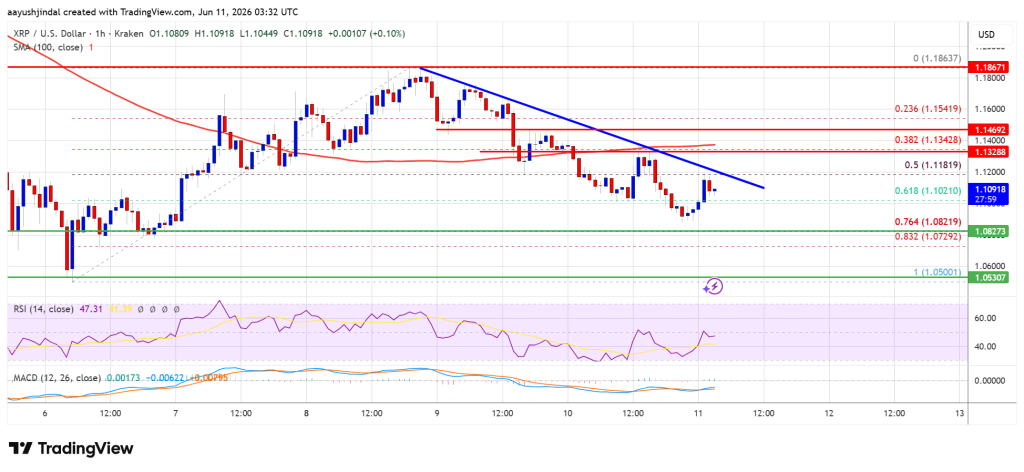
- The price is trading below $1,650 and the 100-hourly Simple Moving Average.
- There is a declining channel forming with resistance at $1,640 on the hourly chart of ETH/USD (data feed via Kraken).
- The pair could continue to move down if it stays below the $1,720 zone.
Ethereum Price Holds Support
Ethereum price failed to stay above the $1,680 zone and extended its decline, like Bitcoin. ETH price gained pace for a move below the $1,665 and $1,650 levels.
The price even tested the 50% Fib retracement level of the upward move from the $1,505 swing low to the $1,720 swing high. However, the bulls were active near the $1,610 level. Besides, there is a declining channel forming with resistance at $1,640 on the hourly chart of ETH/USD.
Ethereum price is now trading below $1,650 and the 100-hourly Simple Moving Average . If the bulls remain in action above $1,610, the price could attempt another increase.
Immediate resistance is seen near the $1,650 level. The first key resistance is near the $1,665 level. The next major resistance is near the $1,680 level. A clear move above the $1,680 resistance might send the price toward the $1,720 resistance. An upside break above the $1,720 region might call for more gains in the coming days. In the stated case, Ether could rise toward the $1,780 resistance zone or even $1,800 in the near term.
Downside Continuation In ETH?
If Ethereum fails to clear the $1,650 resistance, it could start a fresh decline. Initial support on the downside is near the $1,610 level. The first major support sits near the $1,590 zone or the 61.8% Fib retracement level of the upward move from the $1,505 swing low to the $1,720 swing high.
A clear move below the $1,590 support might push the price toward the $1,550 support. Any more losses might send the price toward the $1,520 region. The main support could be $1,500.
Technical Indicators
Hourly MACD – The MACD for ETH/USD is losing momentum in the bearish zone.
Hourly RSI – The RSI for ETH/USD is now above the 50 zone.
Major Support Level – $1,610
Major Resistance Level – $1,665