The post SUI and SEI Price Compress in Tight Ranges—Which Layer-1 Token Is Set to Break Out First? appeared first on Coinpedia Fintech News
Since the start of 2025, the prices of both SUI and SEI have shifted into consolidation after the strong directional waves. SUI surged by over 40%, while SEI rose by close to 25%, but both tokens faced a 9% to 12% pullback and entered a consolidation phase. In the past few sessions, the ranges have tightened further, volume has declined, and momentum indicators have stabalised, a combination that often precedes a decisive breakout.
The focus has now turned to structure and momentum to assess which layer-1 is positioned to break first. Moreover, it could deliver a strong upside following an escape from the persisting price compression.
SUI Price Analysis: Can Bulls Trigger a 100% Upswing?
Since the beginning, the SUI price has remained elevated, holding along the rising trend line that has been a strong support level. However, the price has encountered an important trend reversal level that could flip the course of the SUI price rally if secured with strong volume. However, the crypto is facing some resistance at $1.87, and hence a breakout from this range could be very important for the bullish continuation.
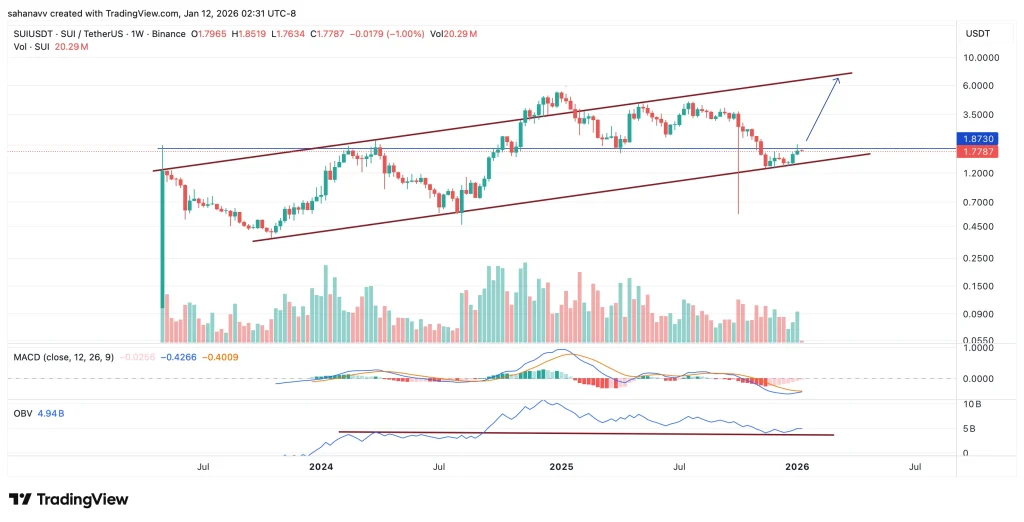
SUI’s weekly chart shows the price holding within a rising parallel channel, indicating a broader bullish structure remains intact. The recent pullback respected the lower trendline near $1.70–$1.75, suggesting buyers continue to defend higher lows. Momentum indicators are stabilizing, while OBV shows early signs of accumulation. A decisive weekly close above $1.90 could validate a breakout and open upside targets near $2.50, followed by $3.20. Failure to hold the channel support would delay the bullish thesis but not invalidate it immediately.
SEI Price Analysis: Can SEI Reach $0.2?
SEI price, in contrast, has remained stuck within a descending parallel channel since 2024 and has bounced from the support. The trend appears to be very similar to the 2025 start, which displayed a rebound and further dropped, forming an inverse curve. Currently, the selling volume is fading with a notable rise in liquidity. Hence, it would be interesting to watch how the upcoming price action could unfold.

The SEI price continues to trade inside a descending channel, reflecting sustained bearish pressure on the higher timeframe. Price remains capped below the mid-range resistance near $0.19–$0.20, while CMF stays negative, signaling capital outflows. MACD also lacks bullish crossover confirmation, highlighting weaker momentum compared to SUI. For SEI to shift bullish, a strong reclaim of $0.20 is required. Until then, downside risk persists toward $0.12–$0.10, keeping SEI structurally behind in the breakout race.
Which Token Could Break Out First?
From a trader’s perspective, Sui currently has the structural edge. Price is compressing inside a rising channel, higher lows remain intact, and downside risk is clearly defined near channel support. This favors a breakout-first scenario, especially if volume expands on a move above $1.90.
Sei, meanwhile, remains in a corrective structure. Any upside attempt without a reclaim of $0.20 risks being sold into. For traders, SUI offers the cleaner breakout setup, while SEI looks more suitable for reactive trades only after confirmation.