The Bitcoin market has suffered through a disappointing performance over the past few weeks, leading to a price retest of the $100,000 support zone. However, an exciting on-chain evaluation predicts a positive price action in the near future.
Bitcoin Price Below Average Cost — Details
On November 8, popular market analyst Burak Kesmeci shared on X the underlying reasons behind his expectations of a bullish reversal. Kesmeci’s post mostly depends on the Bitcoin: 90-Day Market Price vs Realized Price Gradient Oscillator. Essentially, this indicator functions as a means of tracking the distance of Bitcoin’s market price deviation from its realized price over the past 90 days.
A positive reading from the metric indicates a faster rising market price of Bitcoin, compared to its average cost basis (realized price), thereby showing growing bullish momentum. A negative reading, on the other hand, connotes a significant decline of market price beneath realized price, a sign of bearish momentum, which could extend into a ‘cooling’ phase.
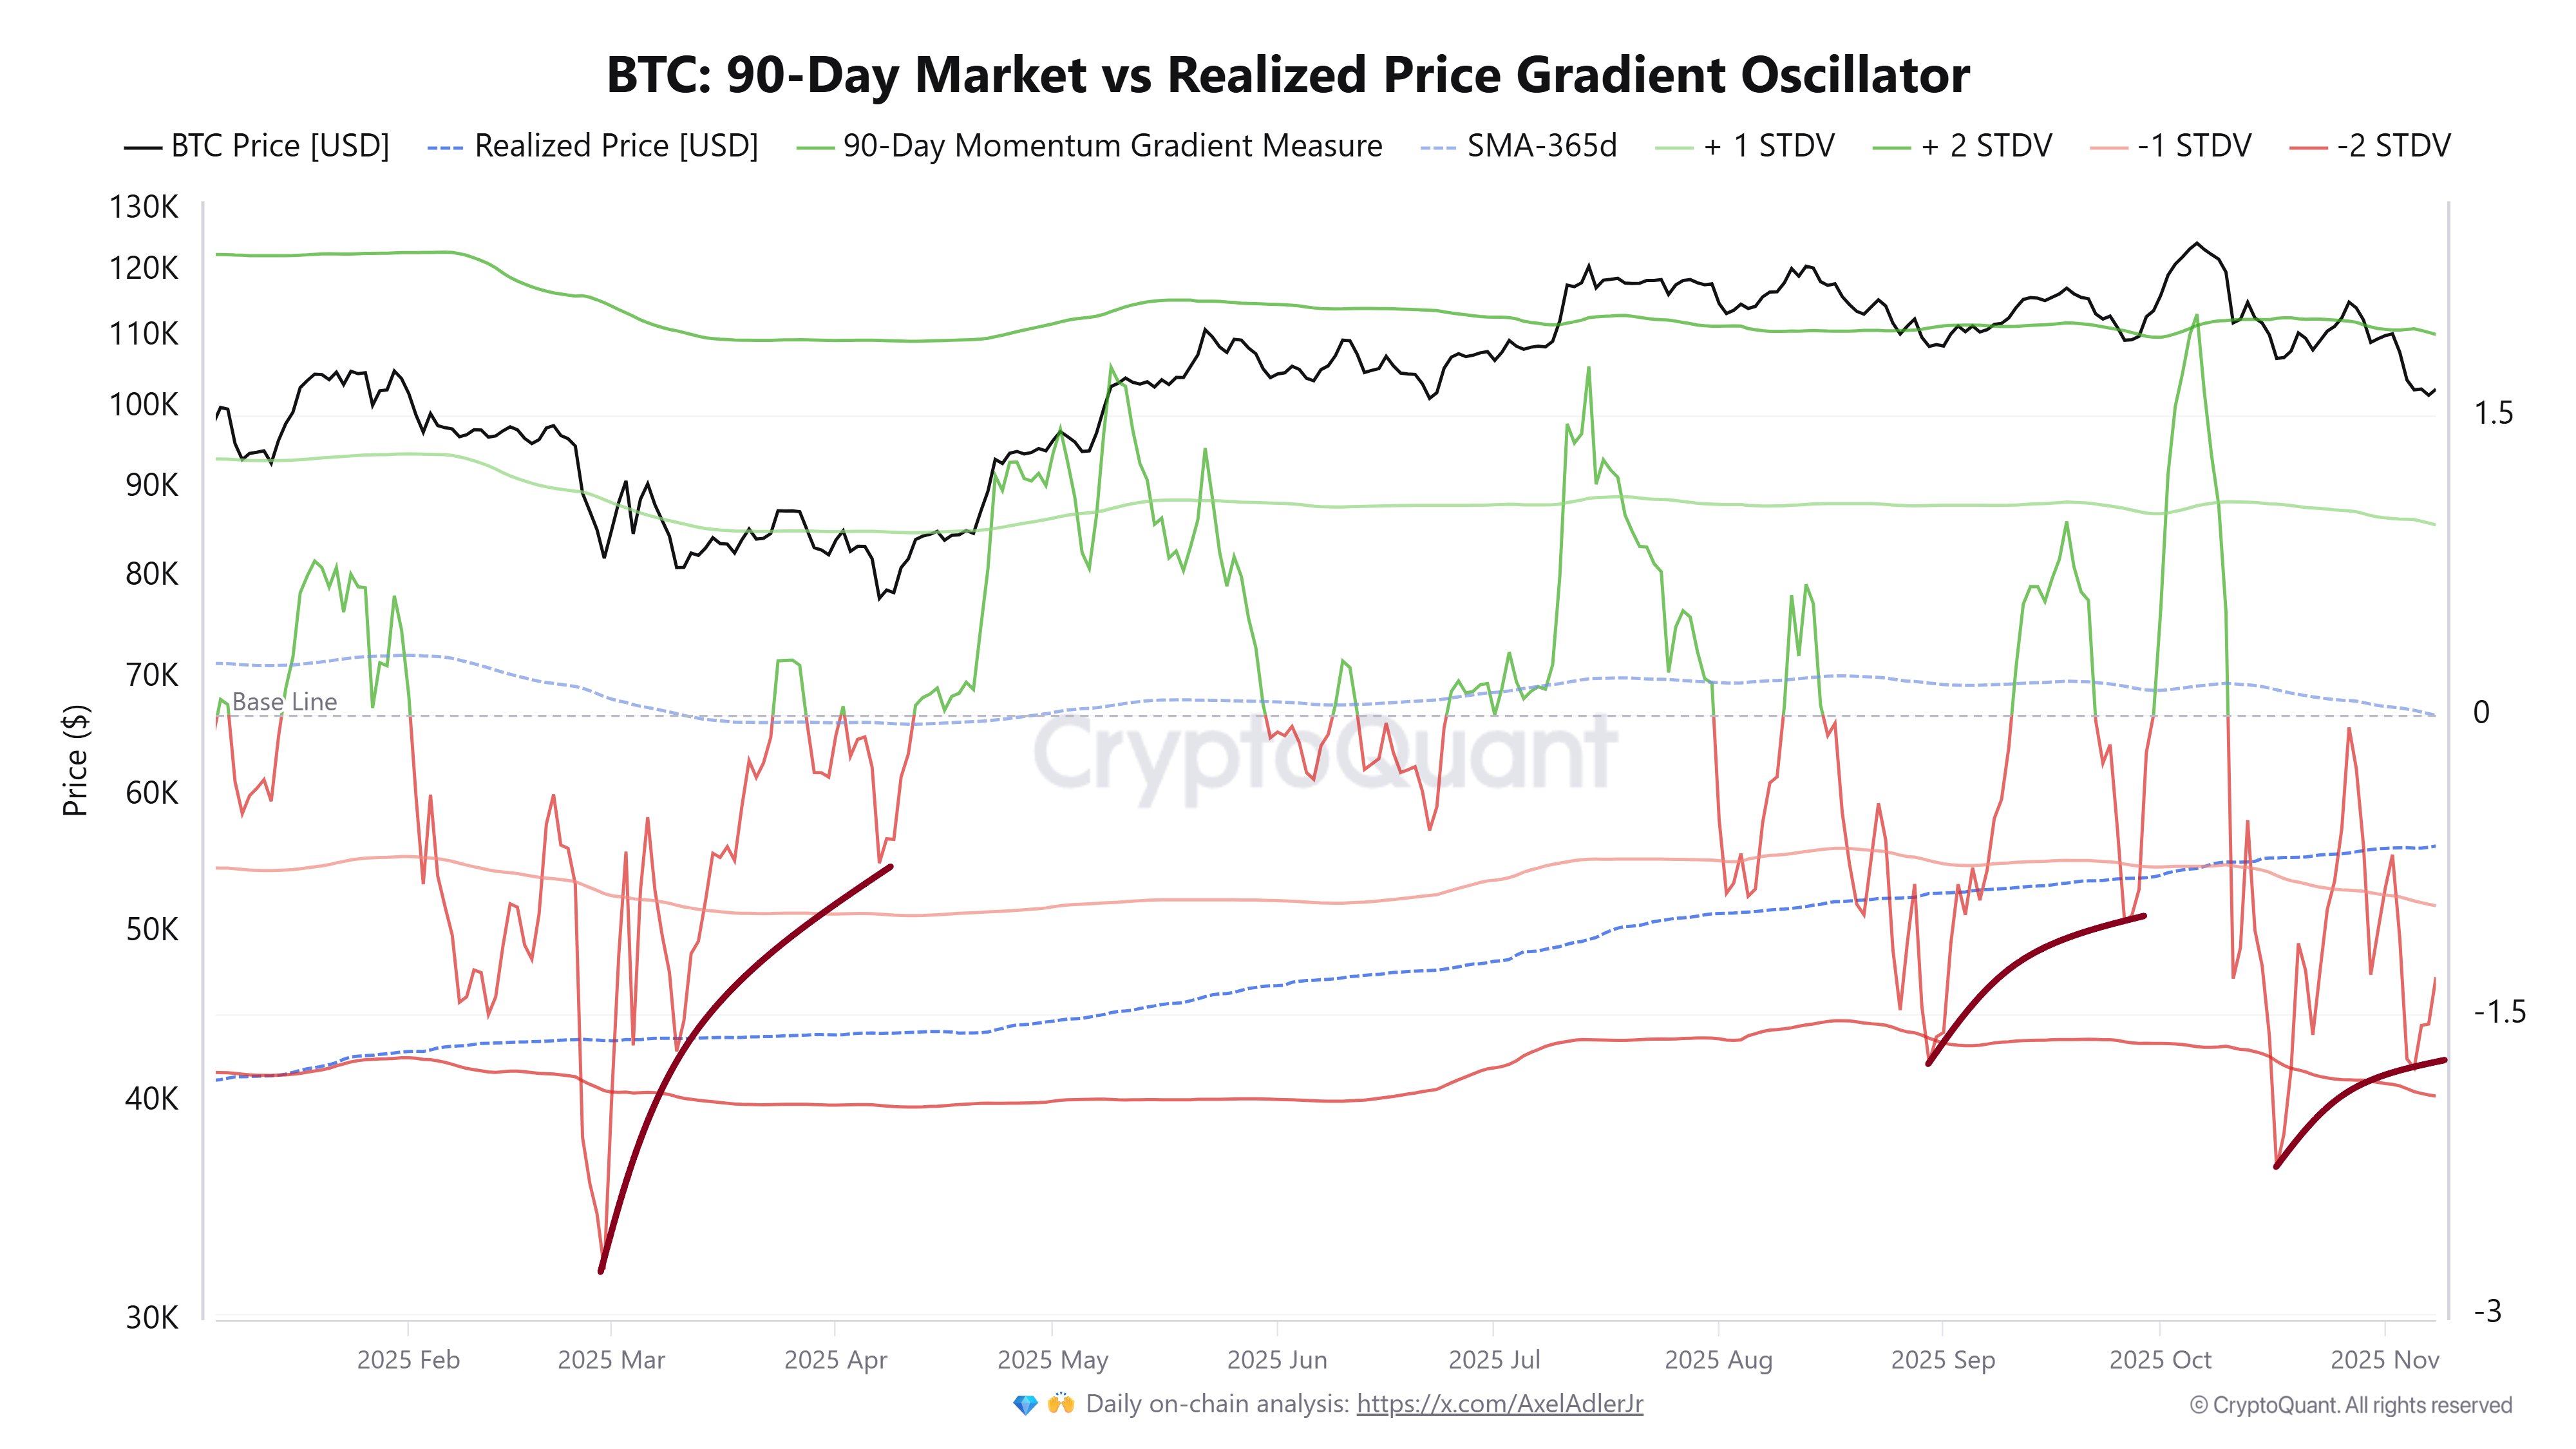
In the post on X, Kesmeci reveals that the metric’s reading has fallen to a value of -1.27 STDV (Standard Deviations). As previously explained, this indicates that the Bitcoin price has greatly fallen beneath its historical cost basis, a development that could point out that the flagship cryptocurrency’s price momentum has reached a state of ‘extreme cooldown.’
Expressed more simply, Bitcoin investors are paying much less than the amount its recent buyers did on average to acquire Bitcoin. If more investors were to purchase Bitcoin around its current price, there could be a total or significant absorption of what already appears to be exhausted bearish pressure.
Notably, Kemesci also referenced past occurrences to buttress his prediction of an imminent price rebound. According to the analyst, periods where this metric fell below -1 STDV have often preceded the ends of downtrends and the beginnings of price expansions. We see this occurrence twice in recent months: first, in April, where Bitcoin saw a rise from about $82,000 to $100,000; and second, where the price saw a growth from $108,000 in July to reach $124,000. Thus, if historical data is reliable, the Bitcoin price could soon put in a new price bottom, after which significant movement to the upside would likely follow.
Bitcoin Price Overview
As of this writing, Bitcoin stands at a valuation of approximately $102,023, reflecting a slight loss of about 0.94% since the last day.