Solana (SOL) Recovery Attempt Builds, But Volume Still Signals Caution


Solana started a fresh decline below the $162 zone. SOL price is now attempting to recover and faces hurdles near the $166 zone.
- SOL price started a fresh decline below $165 and $162 against the US Dollar.
- The price is now trading below $165 and the 100-hourly simple moving average.
- There was a break above a key bearish trend line with resistance at $155 on the hourly chart of the SOL/USD pair (data source from Kraken).
- The price could continue to move up if it clears $165 and $166.
Solana Price Attempts Recovery Wave
Solana price failed to remain stable above $175 and started a fresh decline, like Bitcoin and Ethereum . SOL declined below the $170 and $165 support levels.
The price gained bearish momentum below $160. A low was formed at $145, and the price recently started a recovery wave. There was a move above the 23.6% Fib retracement level of the downward move from the $188 swing high to the $145 low.
Besides, there was a break above a key bearish trend line with resistance at $155 on the hourly chart of the SOL/USD pair. Solana is now trading below $165 and the 100-hourly simple moving average.
On the upside, immediate resistance is near the $165 level. The next major resistance is near the $166 level and the 50% Fib retracement level of the downward move from the $188 swing high to the $145 low. The main resistance could be $172. A successful close above the $172 resistance zone could set the pace for another steady increase. The next key resistance is $180. Any more gains might send the price toward the $188 level.
Another Decline In SOL?
If SOL fails to rise above the $166 resistance, it could continue to move down. Initial support on the downside is near the $160 zone. The first major support is near the $155 level.
A break below the $155 level might send the price toward the $148 support zone. If there is a close below the $148 support, the price could decline toward the $142 zone in the near term.
Technical Indicators
Hourly MACD – The MACD for SOL/USD is losing pace in the bearish zone.
Hourly Hours RSI (Relative Strength Index) – The RSI for SOL/USD is above the 50 level.
Major Support Levels – $155 and $148.
Major Resistance Levels – $165 and $166.
Gemini’s XRP Perps Go Live In EU — Why ‘Top Altcoins’ Like $BEST Are In Play
What to Know: Gemini launches XRP perpetuals for EU traders, offering up to 100x leverage and $USDC ...

Weakness In Major Cryptos: What Key Technical Metrics Indicate For Bitcoin, Ethereum, And Solana
Despite a slight recovery in cryptocurrency prices on Wednesday, experts remain divided on the futur...
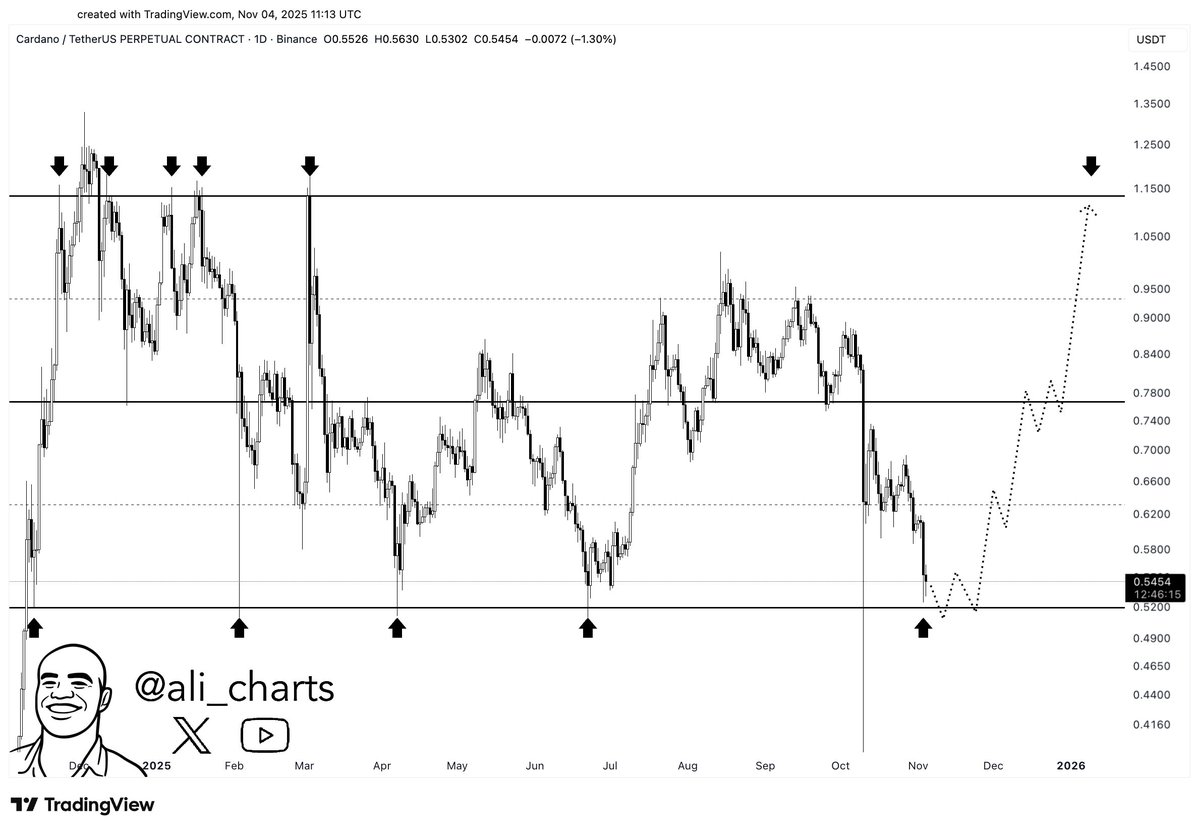
Cardano Retests Line That Has Triggered Strong Rebounds Since Nov 2024
An analyst has pointed out how Cardano is retesting a level that has helped the asset’s price reboun...