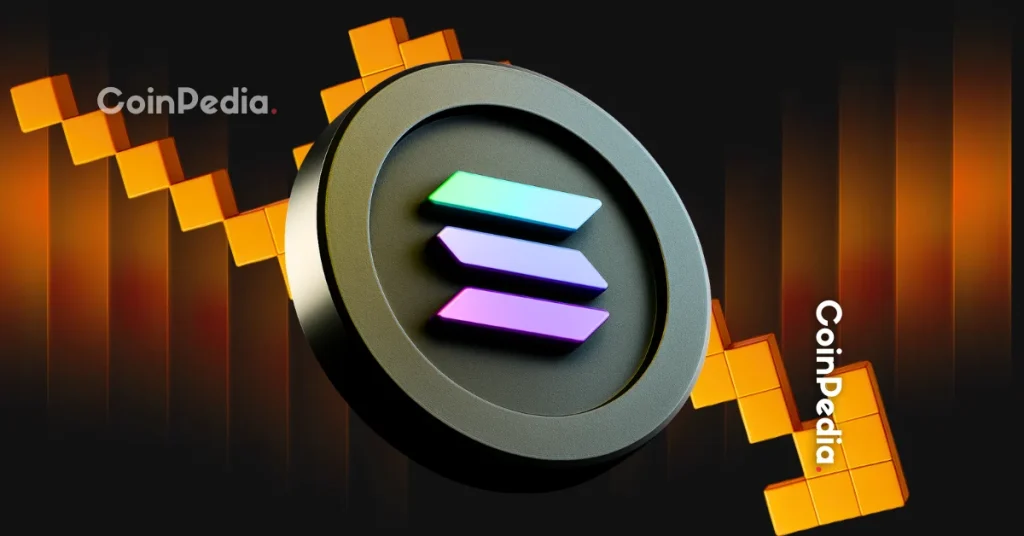
Can Solana Price Hold Above $193 as Bulls Fail to Claim $200 Resistance?


The post Can Solana Price Hold Above $193 as Bulls Fail to Claim $200 Resistance? appeared first on Coinpedia Fintech News
Solana’s price action has been a rollercoaster lately, sparked by several shifting currents in the market. At the heart of today’s fluctuations is a mix of macro uncertainty around the US Fed rate cut, technical resistance near $200. And lackluster excitement from the debut of Bitwise’s Solana ETF.
Market participants rushed to take profit as SOL approached $200, worried that the wider crypto space might see volatility ahead of the central bank’s announcement. This mix led to rejection from the resistance, causing sellers to step in and send the Solana price lower. Despite a weekly climb of 6.3%, the latest Solana news today shows traders are holding their breath. Join me as I look at the Solana price USD chart for clues and targets.
SOL Price Analysis
On the technical front, Solana price is currently testing the $194.71 mark following a sharp rejection at $200. The daily price action reveals that SOL struggled to close above $200 several times. With each attempt drawing in sellers and prompting further profit-taking. Successively, volatility remains high, with a 24-hour range between $191.39 and $203.83 and trading volume surging 18.49% to $7.53 billion.
A key short-term level is the 7-day SMA at $193. If the price of Solana breaks below this support, it opens the door to extended losses, possibly targeting the next support at $177.33. The Bollinger Bands are narrowing, suggesting that price momentum is stalling and the market could enter a rangebound phase. The RSI stands at 45.92, below the 55.17 midline, reflecting a modest bullish momentum but avoiding oversold territory.
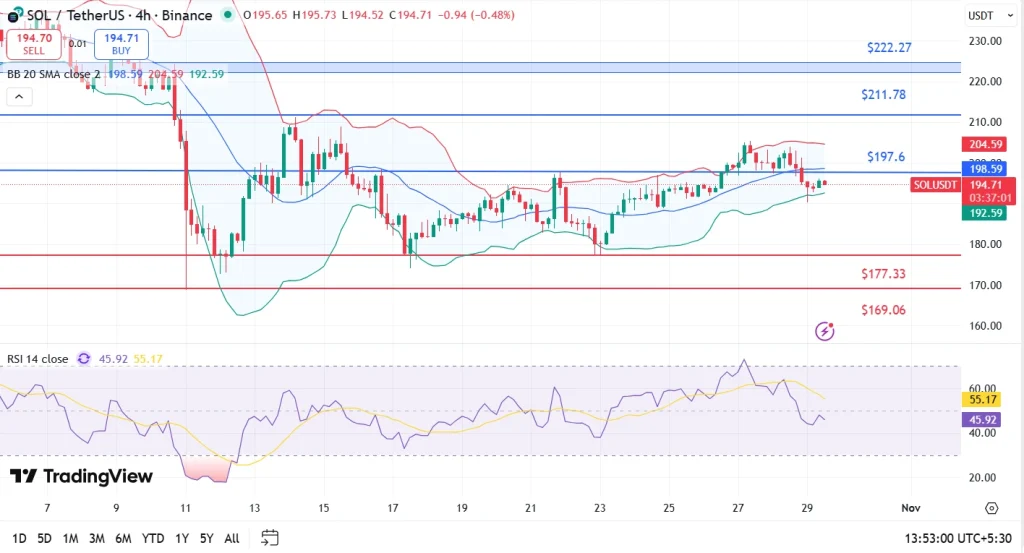
Moving averages suggest a mixed bias with shorter-term averages, like the 7-day and 20-day SMA, flattening out just above and below current prices. The $197.60 and $204.59 zones remain as intermediate resistance levels. This is while downside risks increase if sellers breach the $193 EMA.
Consequently, looking further up, any bullish reversal may see resistance retested at $211.78 or even $222.27.
FAQs
Major support sits near $193 based on the 7-day SMA. Key resistance levels are at $200, then $211.78, and $222.27 on the Solana price USD chart.
The indicators, like the Bollinger Bands and RSI, suggest a neutral to slightly bearish momentum. Monitoring reactions around $193 and $200 is key for near-term moves.
If SOL quickly recovers above $200 and sustains volume, a rebound toward $211 is possible. A loss of $193 support would increase the chance of further downside.

Are CBDCs Now ‘Irrelevant’? Ripple CTO Says the Market Has Moved On
The post Are CBDCs Now ‘Irrelevant’? Ripple CTO Says the Market Has Moved On appeared first on Coinp...

Shiba Inu Price Prediction, Will $0.0000095 Support Prevent a Breakdown?
The post Shiba Inu Price Prediction, Will $0.0000095 Support Prevent a Breakdown? appeared first on ...
Grayscale Launches First U.S. Solana Trust ETF
The post Grayscale Launches First U.S. Solana Trust ETF appeared first on Coinpedia Fintech NewsGra...