Bitcoin Price Slides Lower — Bears Tighten Grip Amid Weak Market Sentiment


Bitcoin price is attempting to recover above $107,500 and $108,000. BTC could rise further if there is a clear move above the $109,500 barrier.
- Bitcoin started a fresh recovery wave above the $108,000 resistance level.
- The price is trading below $109,000 and the 100 hourly Simple moving average.
- There is a short-term declining channel forming with resistance at $108,800 on the hourly chart of the BTC/USD pair (data feed from Kraken).
- The pair might continue to move up if it trades above the $109,500 zone.
Bitcoin Price Takes Hit
Bitcoin price declined again below the $109,500 level. BTC tested the $106,750 zone and is currently consolidating losses . A low was formed at $106,717 before the price recovered some losses.
There was a move above the $107,500 and $108,000 levels. The price climbed above the 23.6% Fib retracement level of the recent decline from the $114,000 swing high to the $106,717 low. However, the bulls are now facing many hurdles.
Bitcoin is now trading below $109,000 and the 100 hourly Simple moving average . Immediate resistance on the upside is near the $108,800 level. There is also a short-term declining channel forming with resistance at $108,800 on the hourly chart of the BTC/USD pair.
The first key resistance is near the $109,500 level. The next resistance could be $110,500 or the 50% Fib retracement level of the recent decline from the $114,000 swing high to the $106,717 low. A close above the $110,500 resistance might send the price further higher. In the stated case, the price could rise and test the $111,500 resistance. Any more gains might send the price toward the $112,000 level. The next barrier for the bulls could be $113,500.
Another Drop In BTC?
If Bitcoin fails to rise above the $109,500 resistance zone, it could start a fresh decline. Immediate support is near the $107,200 level. The first major support is near the $106,750 level.
The next support is now near the $105,800 zone. Any more losses might send the price toward the $105,000 support in the near term. The main support sits at $103,500, below which BTC might struggle to recover in the short term.
Technical indicators:
Hourly MACD – The MACD is now losing pace in the bearish zone.
Hourly RSI (Relative Strength Index) – The RSI for BTC/USD is now near the 50 level.
Major Support Levels – $108,000, followed by $106,750.
Major Resistance Levels – $109,500 and $110,500.
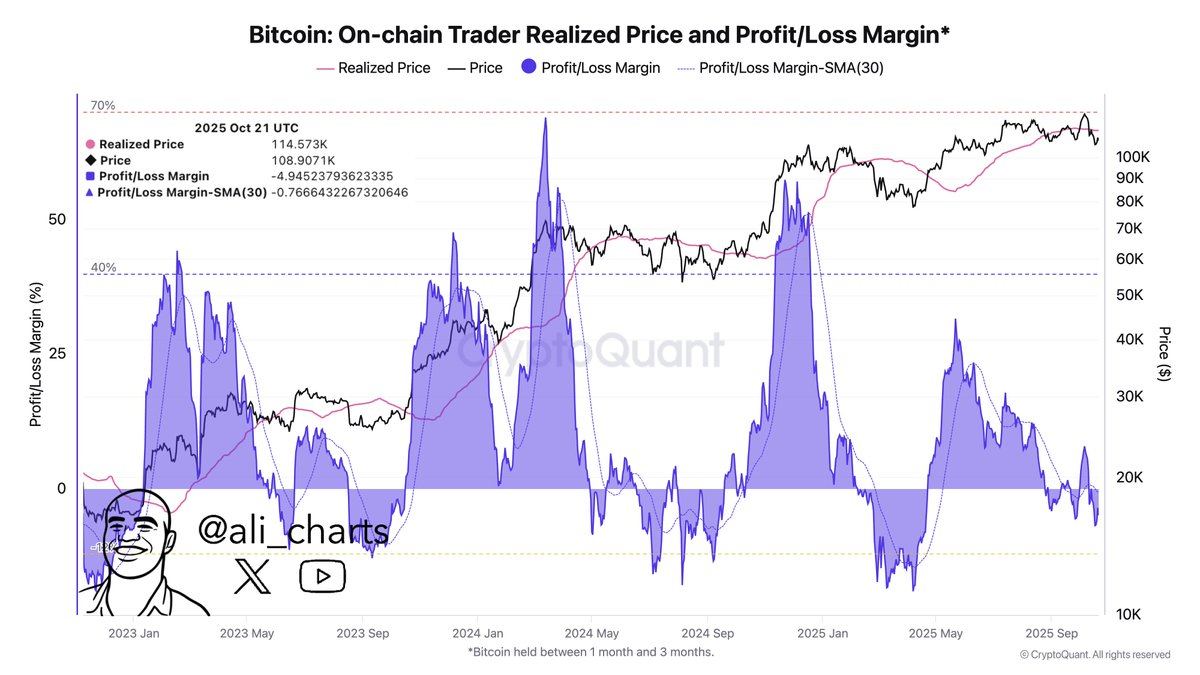
Is Bitcoin Ready For A Rebound? This Metric Says More Pain Needed First
On-chain data shows the loss margin of Bitcoin traders is only halfway through the way to the bounda...
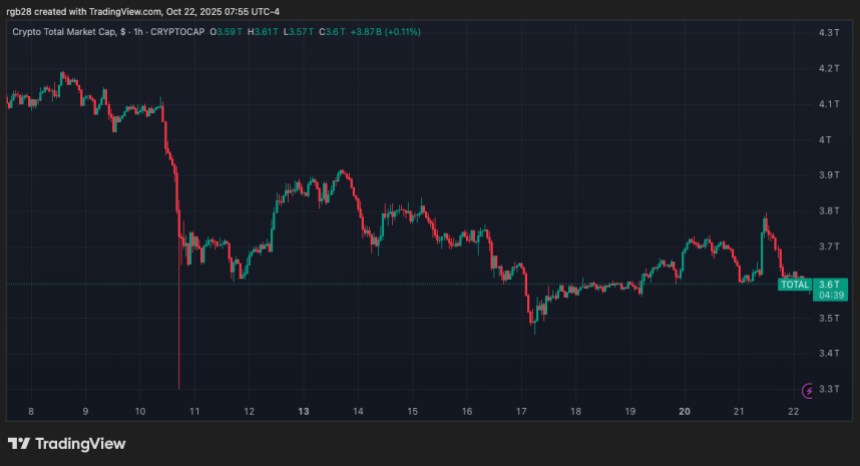
Crypto Market Records ‘Particularly Robust’ Q3 Performance With 16% Active Trader Growth – Report
A recent MEXC Q3 report highlighted the strong performance of the crypto market during the last quar...
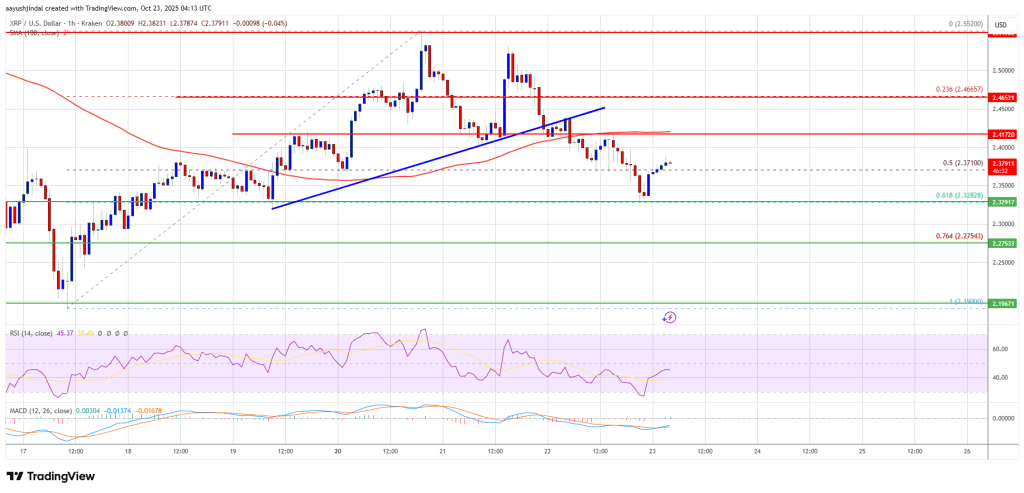
XRP Price Under Pressure — Bulls Attempt To Defend Key Support Zone
XRP price started a recovery wave from $2.20. The price is struggling to clear $2.50 and might decli...