BNB Price Shows Strength—Is a Comeback in Play?


BNB price is recovering from the $595 support zone. The price is rising and might aim for a fresh move toward the $632 resistance.
- BNB price is moving higher above the $610 resistance zone.
- The price is now trading below $630 and the 100-hourly simple moving average.
- There is a connecting bearish trend line forming with resistance at $618 on the hourly chart of the BNB/USD pair (data source from Binance).
- The pair must stay above the $595 level to start another increase in the near term.
BNB Price Eyes Fresh Upside Break
After forming a base above the $590 level, BNB price started a fresh increase. There was a move above the $600 and $610 resistance levels. It even recovered above the $612 level, beating Ethereum and Bitcoin .
There was a decent move above the 50% Fib retracement level of the downward move from the $632 swing high to the $5995 low. However, the bears seem to be active near the $615 and $618 levels. There is also a connecting bearish trend line forming with resistance at $618 on the hourly chart of the BNB/USD pair.
The price is now trading below $620 and the 100-hourly simple moving average. If there is a fresh increase, the price could face resistance near the $618 level. The next resistance sits near the $622 level or the 76.4% Fib retracement level of the downward move from the $632 swing high to the $5995 low.
A clear move above the $622 zone could send the price higher. In the stated case, BNB price could test $632. A close above the $632 resistance might set the pace for a larger move toward the $650 resistance. Any more gains might call for a test of the $665 level in the near term.
Another Decline?
If BNB fails to clear the $622 resistance, it could start another decline. Initial support on the downside is near the $602 level. The next major support is near the $600 level.
The main support sits at $595. If there is a downside break below the $595 support, the price could drop toward the $588 support. Any more losses could initiate a larger decline toward the $565 level.
Technical Indicators
Hourly MACD – The MACD for BNB/USD is gaining pace in the bullish zone.
Hourly RSI (Relative Strength Index) – The RSI for BNB/USD is currently below the 50 level.
Major Support Levels – $600 and $595.
Major Resistance Levels – $622 and $632.

Memecoin Scam Alert: Pump.Fun X Account Hacked, Promotes Fake PUMP Token
The Solana-based memecoin Launchpad Pump.fun’s X account has been hacked and used to promote fake cr...
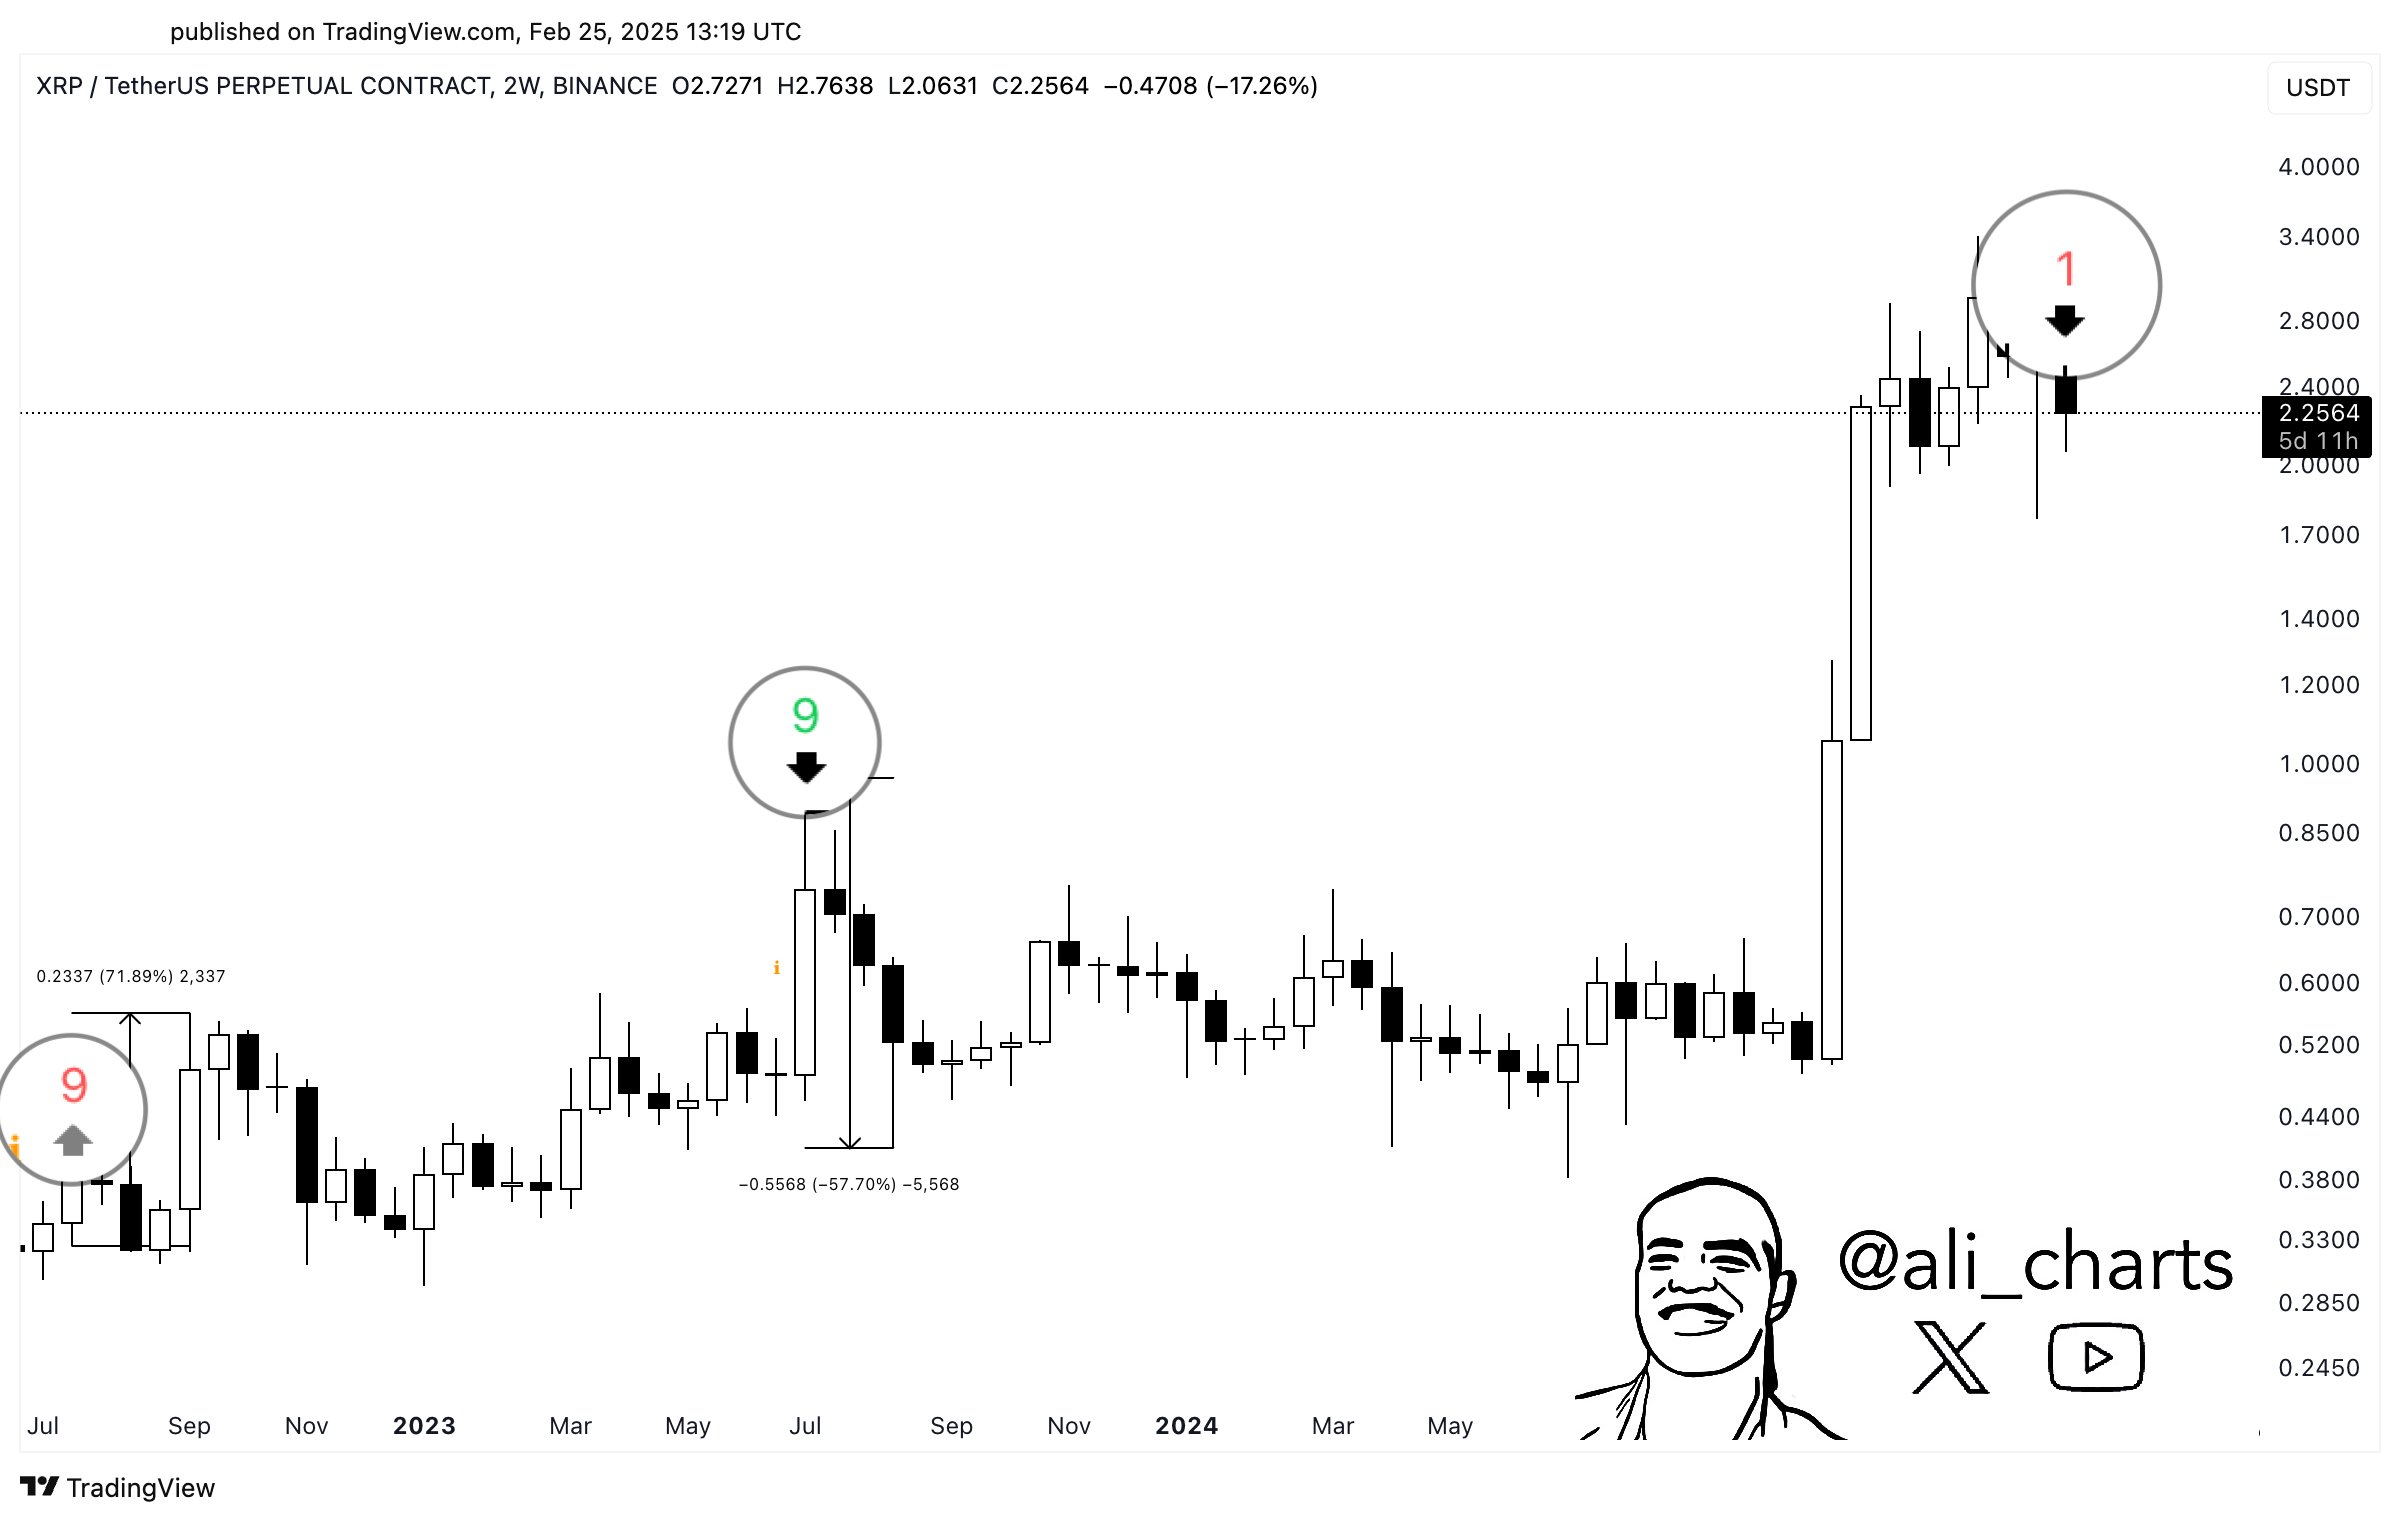
XRP Indicator Reliable Since 2022 Now Gives This Signal
An analyst has pointed out how the Tom Demark (TD) Sequential has once again formed a signal on the ...
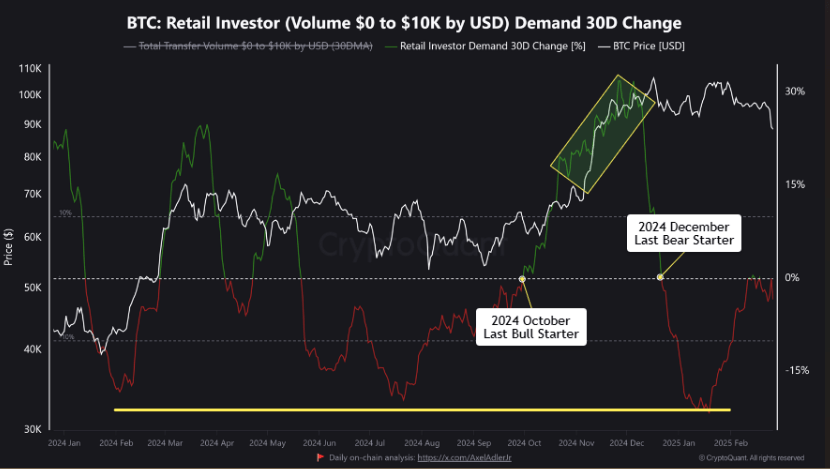
Bitcoin Faces Critical Test as Retail Demand Hits Resistance Levels
Bitcoin (BTC) is currently trading just below $88,000, a significant drop from its all-time high of ...